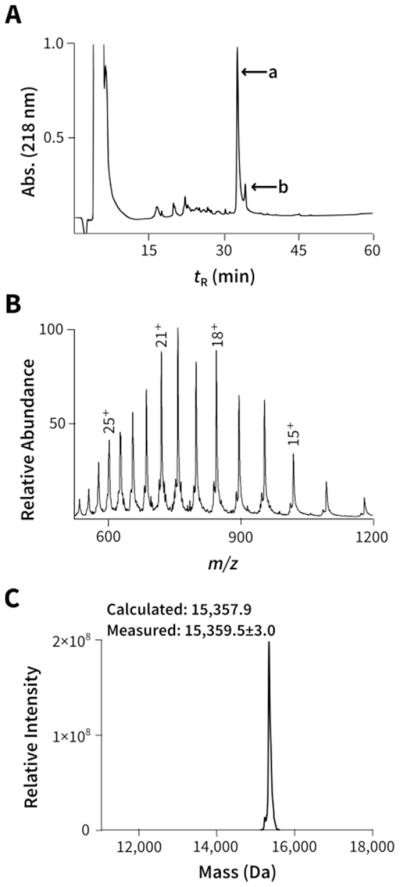
Figure 2.

Representative characterization data for hydrazide mimics (data shown for H3-Kc56hib, remainder of the hydrazide mimics are in Supplementary Figures). (A) HPLC trace, peak ‘a’ corresponds to H3-Kc56hib and after ESI-MS analysis ‘b’ was attributed to the minor side product 7, shown in Fig. 1C. (B) ESI-MS of HPLC fractions corresponding to peak ‘a’. (C) Deconvolution of ESI-MS spectra shown in Fig. 2B above. Reported here are the Average Masses (Mav).
