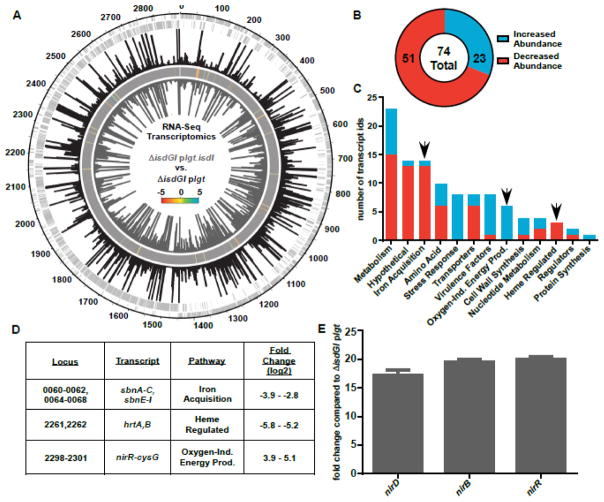
Fig. 2. Constitutive expression of isdI leads to an increase in transcripts associated with non-aerobic growth.
RNA-Sequencing analysis comparing RNA from ΔisdGI plgt.isdI to ΔisdGI plgt. A, RPKM mapping of RNA-Seq data for ΔisdGI plgt (black bars, fourth strip) and ΔisdGI plgt.isdI (grey bars, sixth/inner strip) mapped relative to the chromosomal location (outer strip) for each of the positive strand (second strip) and negative strand (third strip) genes. A heat map (fifth strip) is included showing the log2-fold changes for transcripts with significant q-values. B, Pie chart showing the number of total differentially abundant transcripts, as well as the number with increased (blue) and decreased (red) abundance. C, Pathway analysis was performed for the differentially abundant transcripts with KEGG Pathway. The number of transcript identifications which fall into each pathway bin is shown, as well as whether the transcript has increased (blue) or decreased (red) abundance. D, Fold change values for a subset of transcripts identified in the RNA-Seq analysis from the iron acquisition, heme regulated, and oxygen-independent energy production pathways. E, qRT-PCR analysis of the nitrite reductase operon transcripts confirming their increased abundance in ΔisdGI plgt.isdI compared to ΔisdGI plgt (Student’s T-test, p<0.05, error bars represent S.E.M.).

