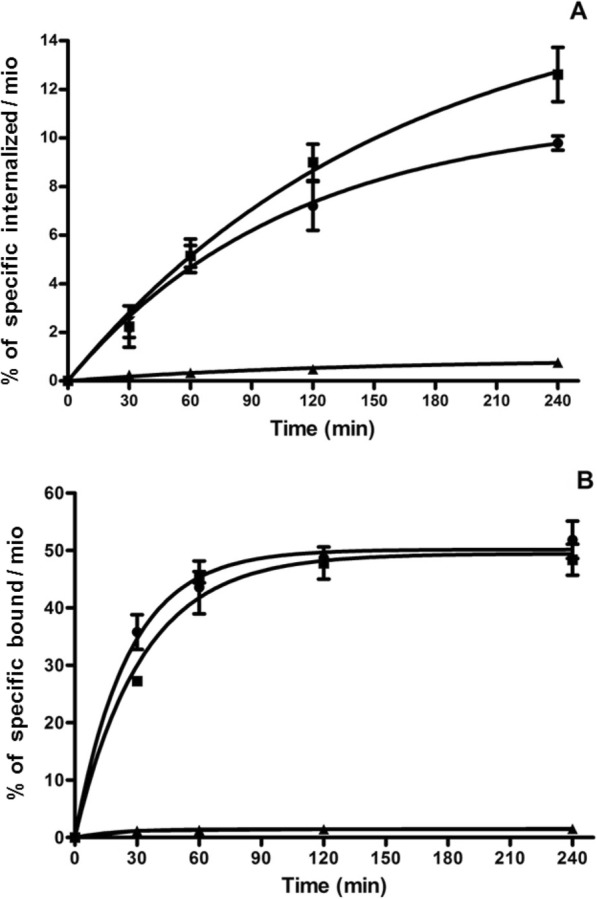
Fig. 3.

In vitro cellular uptake profile of the radioligands on HEK293-rsst2 cells. Cellular uptake profile of 177Lu-SS-03 (circle), 99mTc-SS-04 (square), and 99mTc-SS-05 (triangle) as measured with HEK293-rsst2 cells. a The amount of specifically internalised and b radiopeptides specifically bound to the membrane. Values and standard deviations are the result of two independent experiments with triplicates in each experiment
