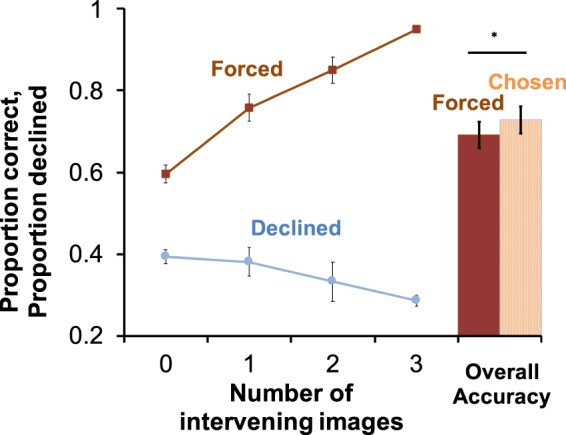
Figure 2.

Accuracy and use of the decline-test response. Monkeys were more accurate the further separated the test images were in the study list (left, top line; F3,15 = 43.97, P < 0.001). Monkeys used the decline-test response in a pattern that mirrored accuracy, with monkeys more likely to decline difficult than easy trials (left, lower line; F3,15 = 11.06, P < 0.001). As a result of selective use of the decline-test response on more difficult trials, monkeys were more accurate on tests they chose to take than on those they were forced to take (right, bar graph; paired sample t-test t5 = 4.29, p < 0.01). Error bars represent standard error of the mean.
