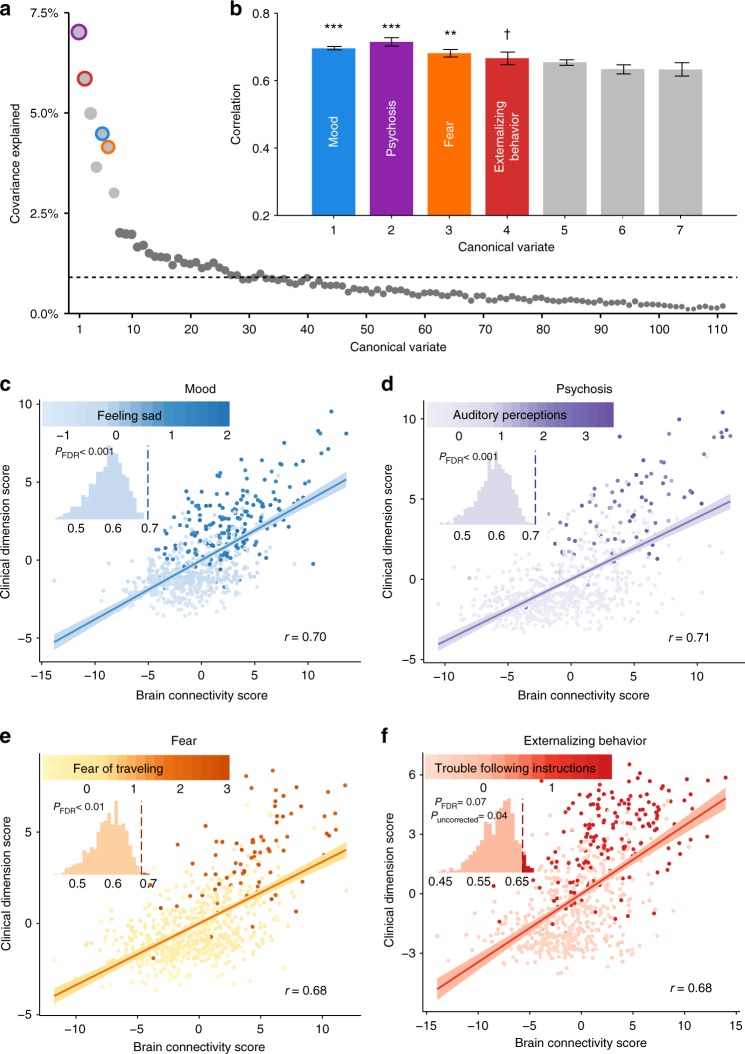
Fig. 3.
sCCA reveals multivariate patterns of linked dimensions of psychopathology and connectivity. a The first seven canonical variates were selected based on covariance explained. Dashed line marks the average covariance explained. b Three canonical correlations were statistically significant by permutation testing with FDR correction (q < 0.05), with the fourth one showing an effect at uncorrected thresholds. Corresponding variates are circled in (a). Error bars denote standard error. Dimensions are ordered by their permutation-based P value. c–f Scatter plots of brain and clinical scores (linear combinations of functional connectivity and psychiatric symptoms, respectively) demonstrate the correlated multivariate patterns of connectomic and clinical features. Colored dots in each panel indicate the severity of a representative clinical symptom that contributed the most to this canonical variate. Each insert displays the null distribution of sCCA correlation by permutation testing. Dashed line marks the actual correlation. ***PFDR < 0.001, **PFDR < 0.01, †Puncorrected = 0.04

