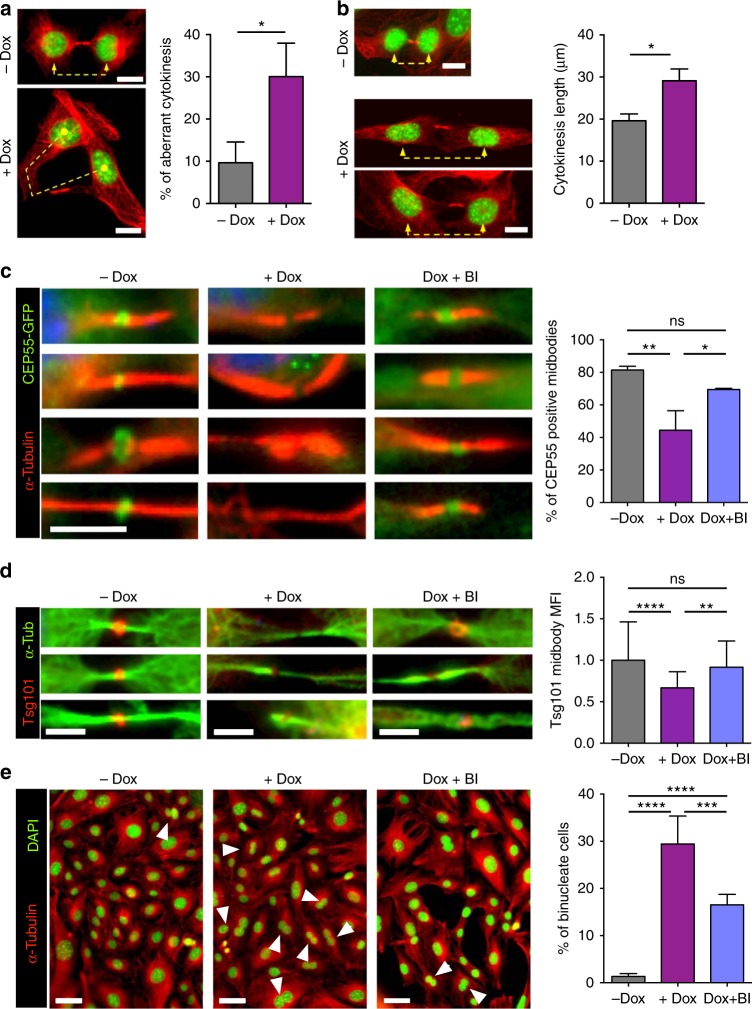
Fig. 5.
Overexpression of Plk1 impairs Cep55 and ESCRT loading into the cytokinesis midbody. a (+/Plk1);(rtTA/rtTA) MEFs were untreated (–Dox) or treated for 24 h with doxycycline (+Dox), fixed and stained for α-tubulin (red) and DAPI (DNA, green). Cells in cytokinesis (n > 100 per condition; n = 3 replicates) were evaluated for aberrant cytokinesis, considering the midbody formation and shape, and correct distribution of DNA into the two daughter cells. Scale bars, 10 μm. b The length of the cytokinesis bridge was evaluated by measuring the distance in between the two daughter nuclei in MEFs untreated or after 24 h of Dox treatment (–Dox, n = 17 cells; +Dox, 23 cells). Scale bars, 10 μm. In a, b *, p < 0.05; Student’s t-test. c MEFs expressing a CEP55-EGFP fusion (green) were treated for 24 h with Dox (+Dox), in the absence or presence of 1 μM of the Plk1 inhibitor BI2536 for 1 h at the end of the Dox time (Dox + BI), or left untreated as control (–Dox). α-tubulin is in red. Data represent the percentage of cells with positive CEP55-EGFP signal at the midbody (–Dox, n = 134; +Dox, n = 94; Dox + BI, n = 47 cells; n = 3 replicates (–Dox, +Dox) or 2 replicates (Dox+BI)). Scale bar, 5 μm. d MEFs expressing a Tsg101-mCherry fusion (red) were treated for 24 h with Dox (+Dox), in the absence or presence of 1 μM of BI2536 for 1 h at the end of the Dox time (Dox + BI), or left untreated as control (–Dox). α-tubulin is in green. Data represent Tsg101-mCherry mean intensity at the midbody (–Dox, n = 81; +Dox, n = 60; Dox + BI, n = 37 cells; n = 2 replicates). Scale bars, 5 μm. e MEFs were treated for 24 h with Dox (+Dox), in the absence or presence of 1 μM of BI2536 for 1 h at the end of the Dox time (Dox + BI), or left untreated (–Dox). Cells were stained for α-tubulin (red) and DAPI (DNA, green) and binucleation index was quantified from more than 600 cells in each sample (n = 5 replicates). Scale bars, 50 μm. In c–e, n.s. not significant; *p < 0.05; **p < 0.01; ***p < 0.001; ****p < 0.0001; one-way ANOVA

