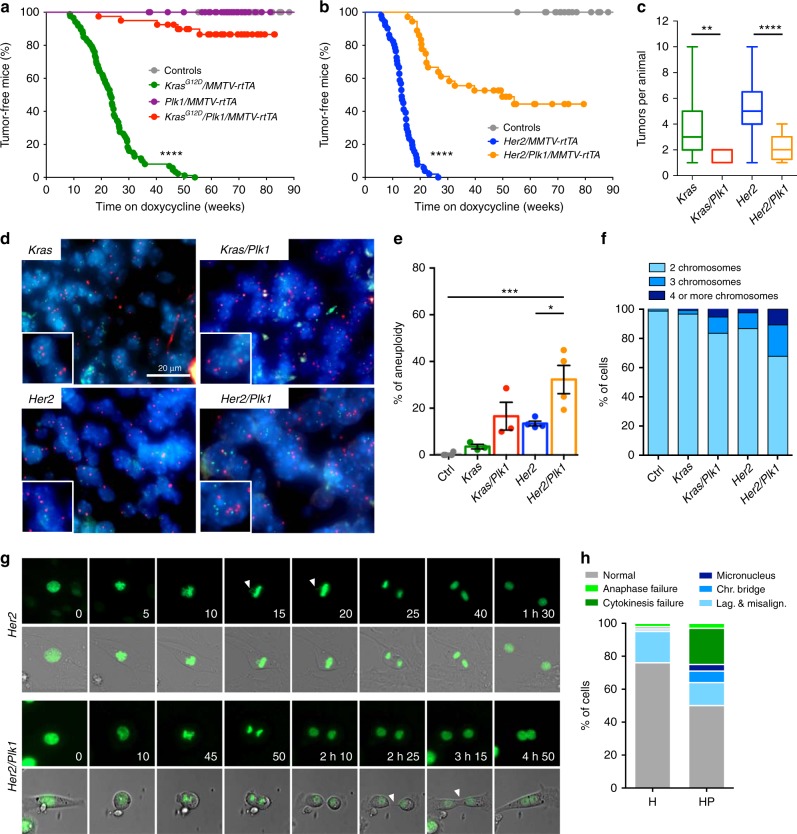
Fig. 6.
Plk1 overexpression reduces tumor development induced by Kras or Her2 oncogenes. a Percentage of tumor-free mice after doxycycline administration (control, n = 33; Plk1/MMTV-rtTA n = 35; KrasG12D n = 87; KrasG12D/Plk1 n = 40 mice). b Percentage of tumor-free survival after doxycycline administration (control, n = 33; Her2, n = 51; Her2/Plk1, n = 36 mice). In a, b, ****p < 0.0001, Mantel–Cox test. c Number of tumors per animal in the indicated genotypes; **p < 0.01; ****p < 0.0001; Mann–Whitney test. d Interphase-Fluorescent in situ hybridization (I-FISH) on paraffin sections of mammary tumors using two centromeric probes against chromosomes 16 and 17. e Quantification of the frequency of aneuploidy (left) in samples from the indicated genotypes (control, n = 4; Kras, n = 4; Kras/Plk1, n = 3; Her2, n = 4; Her2/Plk1, n = 4 mice). *p < 0.05; ***p < 0.001; one-way ANOVA. f Percentage of cells with 2, 3, or 4 or more chromosomes in the indicated genotypes. g Representative micrographs of Her2 and Her2/Plk1 tumor cells in vitro (H2B-GFP green). Top: mitotic cell with a lagging chromosome. Bottom: cytokinesis failure resulting in binucleation. h Percentage of cells in Her2 tumors (H) and Her2/Plk1 (HP) with the indicated mitotic errors

