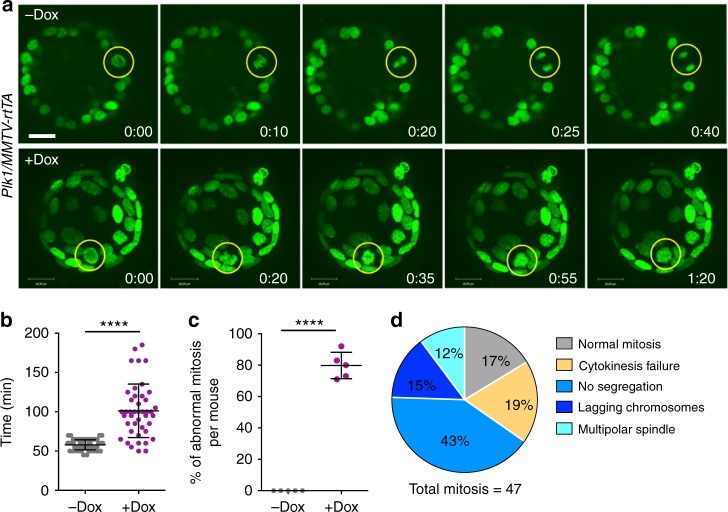
Fig. 7.
Mitotic aberrations in cultured Plk1-overexpressing mammary organoids. a Time-lapse microscopy of Plk1/MMTV-rtTA mammary organoids expressing H2B-GFP either untreated (upper panel) or after 24 h on Dox (lower panel). Yellow circles indicate mitotic cells; H2B-GFP (green). Scale bar, 18 μm. b Duration of mitosis in the organoid cultures (–Dox, 57 cells; +Dox, 43 cells). c Percentage of mitotic errors per mouse (–Dox, 57 cells from 5 mice; +Dox, 47 cells from 5 mice). In b, c, ****p < 0.0001, Student’s t-test. d Classification of mitotic phenotypes in organoid cells overexpressing Plk1 after 36 h on Dox

