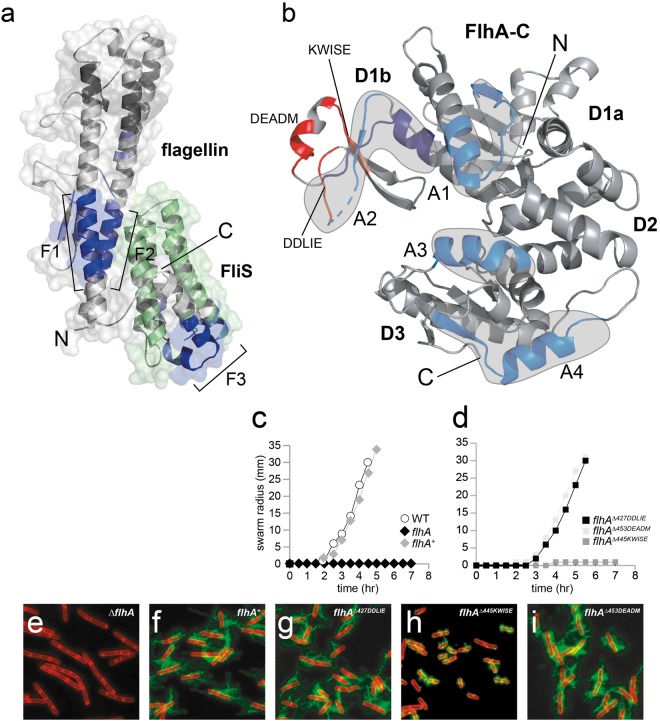
Figure 2.
Recruitment of the FliS/flagellin/FliW complex to FlhA-C. (a) HDX analysis of flagellin/FliS in the presence of FlhA-C. Difference in HDX-labelling is shown in different shades of blue (dark blue: strong protection; light blue: weak protection) in Dalton. Regions in the cartoon representation of flagellin/FliS that exchange less in the presence of FlhA-C are highlighted (F1, F2 and F3). FliS is shown in green as no HDX-data were obtained. (b) HDX analysis of FlhA-C in the presence of flagellin/FliS. The difference in HDX-labelling is shown. Blue regions in the cartoon representation of FlhA-C exchange less in the presence of flagellin/FliS and are encircled in grey (A1, A2, A3 and A4). Peptides deleted within the D1b domain are highlighted in red. (c,d) Quantitative swarm expansion assay for flhA mutant and complementation strains: WT is swarming proficient and covers a 0.7% LB agar plate in about 4.5 hours but ΔflhA is non-swarming. The flhAΔ445KWISE mutant strain shows also a strong swarming deficiency (e–i) Fluorescence microscopy of B. subtilis showing deficiency in filament assembly of a flhA and flhAΔ445KWISE mutant. Scale bars are 2 µm.

