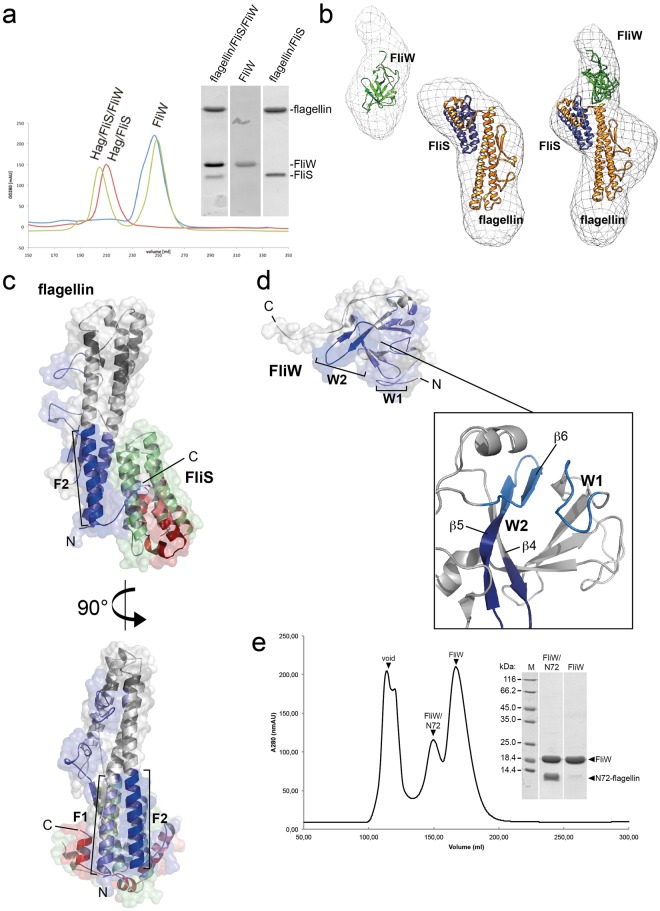
Figure 4.
SAXS- and HDX-analysis of the FliS/flagellin/FliW interaction. (a) Size-exclusion chromatograms (SEC) of flagellin/FliS (red), FliW (blue) and FliS/flagellin/FliW (green). The inset shows a Coomasse-stained SDS PAGE of the peak fractions. (b) SAXS analysis of FliW, flagellin/FliS and FliS/flagellin/FliW. The crystal structures have been fitted to the SAXS-density with the docking algorithm implemented in Chimera. (c) HDX analysis of flagellin/FliS versus flagellin/FliW. The difference in HDX-labelling is shown from blue (less exchange) to red (more exchange) in Dalton. Blue regions in the cartoon representation of flagellin/FliS exchange less in the presence of FliW (F1 and F2), whereas red regions get unprotected. (d) HDX analysis of FliW versus flagellin/FliW. The difference in HDX-labelling is shown from blue (less exchange) to red (more exchange) in Dalton. Blue regions in the cartoon representation of FliW exchange less in the presence of flagellin (W1 and W2). (e) SEC-chromatogram of a flagellinN72/FliW complex (left) and a Coomassie-stained SDS-PAGE of the two peak fractions (right).

