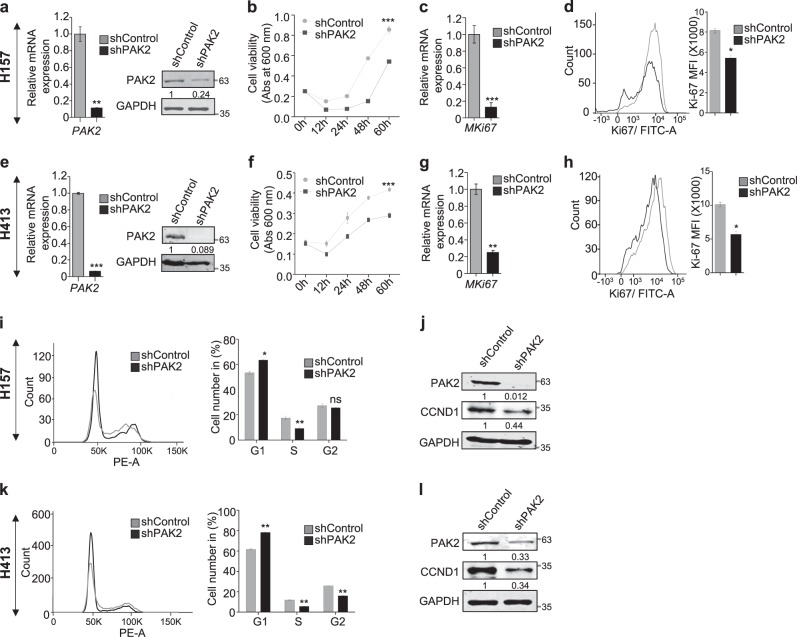
Fig. 2. PAK2 affects proliferation of head and neck cancer cells.
PAK2 expression was depleted in two types of HNC cell lines (H157 and H413), and differential proliferation status of these cell lines was analyzed. a, e Knockdown of PAK2 expression was analyzed at mRNA and protein levels (n = 3). b, f Relative cell proliferation was analyzed through MTT assay (n = 3). c, g mRNA and d, h protein expression status of cell proliferation marker Ki67 (left) was analyzed through qPCR and flow cytometer, respectively. (Right) Mean fluorescence intensity (MFI) of Alexa Fluor 488-Ki67 was measured using software FlowJo 10 (n = 3). i, k (Left) Cell-cycle stages were analyzed using flow cytometer (representative image of 3 independent experiment) (right) bar graph shows average of three independent experiments and j, l cyclin D1 (CCND1) protein expression level was analyzed through immunoblotting (n = 3). Abs absorbance. Samples in (a–c) and (e–g) were analyzed in duplicate. Error bars shows mean values ± SD. Differences were considered statistically significant with *P < 0.05, **P < 0.01 and ***P < 0.001, ns non-significant difference (P > 0.05)

