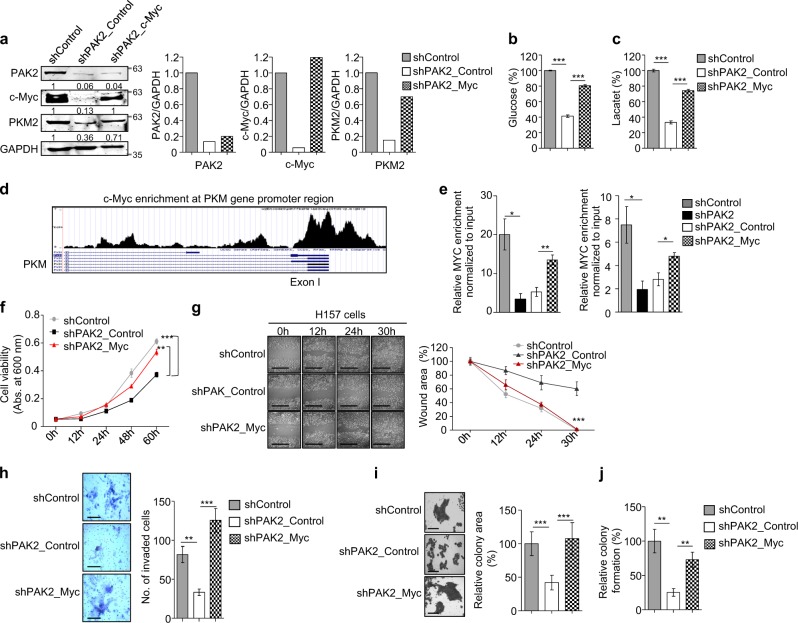
Fig. 5. c-MYC complementation rescues the active proliferation.
PAK2 expression was depleted in H157 cells, and c-Myc was ectopically overexpressed to understand the interdependency of PAK2 and c-Myc to induce oncogenesis. The key cancer hallmarks were analyzed upon c-Myc complementation in PAK2-deficient cells. a (Left) Protein expression of PAK2, c-Myc and PKM2 was analyzed upon c-Myc overexpression through immunoblotting (n = 3). (Right) Densitometric analysis of representative blot. b The level of glucose uptake and c lactate production was analyzed (n = 3). d Representative image shows the c-Myc enrichment at PKM gene promoter region, analyzed using UCSC genome browser. e Shown is the enrichment of c-Myc at PKM gene promoter region, analyzed with c-Myc ChIP (n = 3). f Relative cell proliferation was analyzed through MTT assay (n = 3). g Cell migration was analyzed through wound healing assay, (left) wound was observed under the microscope, scale bar: 500 µm, (right) quantification of wound width (n = 3), h cell invasion was analyzed upon crystal violet staining through Matrigel invasion assay, (left) single field of invaded cells was captured under the microscope, scale bar: 250 µm, (right) invaded cells were counted at five different fields under the microscope (n = 3), i colony-forming tendency of cells was analyzed, (left) colony sizes were observed under the microscope, scale bar: 250 µm, and (right) quantification of colony size measured with ImageJ. j Number of colonies were counted manually after crystal violet staining of the cells (n = 3). shPAK2_Control shPAK2+pAIP, shPAK2_Myc shPAK2+c-MYC. Error bars shows mean values ± SD. Differences were considered statistically significant with *P < 0.05, **P < 0.01 and ***P < 0.001

