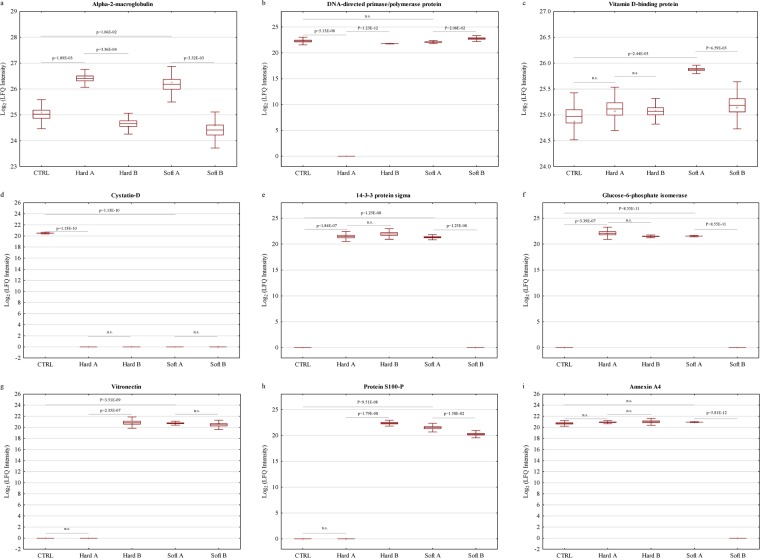
Figure 4.
Differential expression profiles of exemplary tear proteins of hard and soft CL users compared to CTRL. Box plots showing the different expression profiles of some of the significantly (p < 0.05) differentially expressed tear proteins in the two CL users that were restored to near-normal after renouncement comprising (a) A2M (b) PRIMPOL and (c) GC. Some proteins were not restored to near-normal or normal levels following the discontinuation of CL use, which comprised (d) CST5 in both CL users, (e) SFN and (f) GPI in the hard CL users. The expression profiles of (g) VTN and (h) S100P show exemplary proteins that were only up-regulated after hard CL renouncement and, (i) ANXA4 was exclusively down-regulated in the soft CL following renouncement. The y-axis represents the log2 LFQ intensities of the proteins. Box represents the mean ± SE, whiskers represent mean ± 2*SD, plus sign (+) denotes the median and the horizontal line in the box denotes mean.

