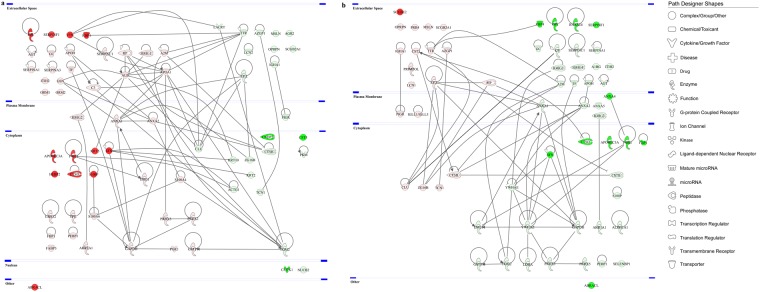
Figure 6.
Protein-protein interaction networks of the differentially expressed tear proteins of soft CL users. The PPI networks of differentially expressed tear proteins obtained by IPA analysis (QIAGEN Inc., https://www.qiagenbioinformatics.com/products/ingenuity-pathway-analysis)78 in soft CL users (a) before and (b) after CL discontinuation. Red and green shading indicate up- and down-regulation of the proteins, respectively. The intensity of the node colour indicates the degree of differential regulation. The various shapes are representation of different protein functions.

