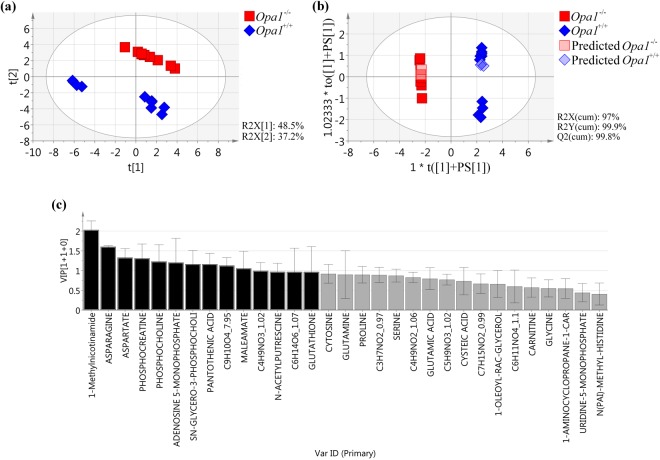
Figure 4.
Metabolomic signature of Opa1−/− vs Opa1+/+ MEFs. (a) Unsupervised PCA score plot of Opa1+/+ (blue rhombuses) and Opa1−/− (red squares) MEF cell lines. There is a spontaneous separation on the t[2] axis related to genotype. (b) Supervised OPLS-DA score plot of Opa1+/+ (blue rhombuses) and Opa1−/− (red squares) MEF cell lines with the prediction of test samples (predicted Opa1+/+ (light blue rhombuses) and predicted Opa1−/− (light red squares)). The model, constructed with 31 molecules (shown in c), discriminates the Opa1 genotype on the t([1] + PS[1]) axis. (c) VIP plot showing the contribution of each metabolite to the model described in b. Molecules emphasized in black (VIP > 1) were considered the most significant molecules of the Opa1 signature.

