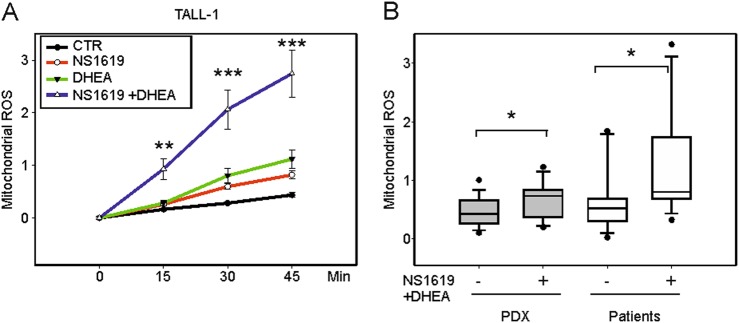
Fig. 1. NS1619 and DHEA increase mtROS.
mtROS accumulation was measured using MitoSOXRed and flow cytometry and expressed as ΔF/F0 ratios (see Materials and Methods). A mtROS accumulation in TALL-1 cells (three independent experiments, three replicates each) without treatment (CTR, black line) and in the presence of NS1619 (red), DHEA (green), or NS1619 + DHEA (blue). B mtROS accumulation in PDX after 45 min (gray boxes, left, N = 5, 3 replicates each) and primary cells from T-ALL patients (white boxes, right, N = 7, 2 replicates each) in the absence ( − ) or presence ( + ) of NS1619 + DHEA. Mean values and SE bars are shown

