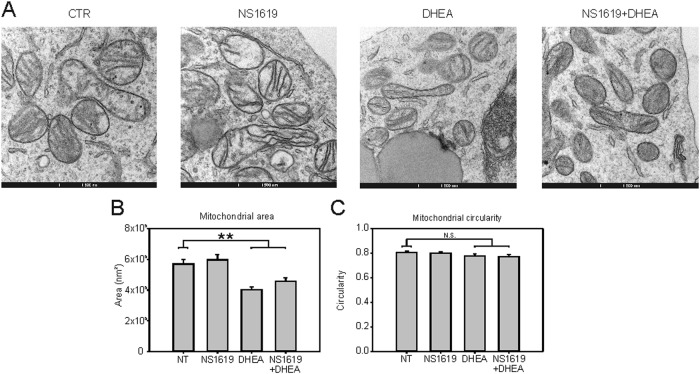
Fig. 5. Effects of NS1619 + DHEA on mitochondrial morphology.
A Representative images of electron microscopy analysis showing mitochondria of TALL-1 cells after 24 h of treatment with NS1619 and DHEA. B, C Quantification of mitochondrial area (B) and circularity (C) (see Materials and Methods) in TALL-1 cells subjected to the indicated treatments for 24 h. The graph shows mean values and SE bars from analysis of at least 130 mitochondria per treatment

