Fig. 2.
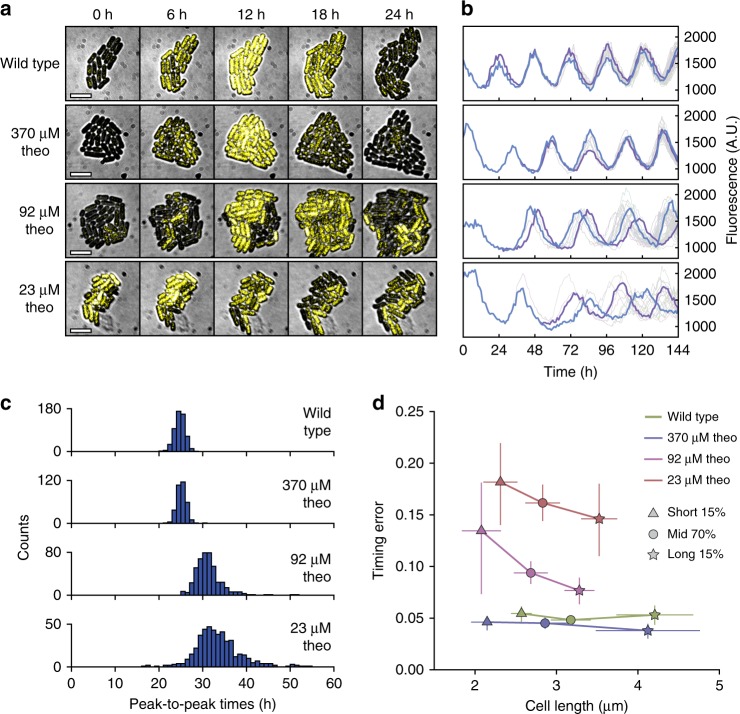
Single cell microscopy reveals desynchronized oscillations at low Kai copy number. a Filmstrips of YFP oscillations in wild-type cells and the copy number tunable strain induced with 1 μM IPTG and various theophylline concentrations (brightfield and YFP fluorescence overlaid). Scale bar: 5 μm. b Single cell oscillator trajectories (gray) with two example cell lineages highlighted (blue and purple). c Distributions of peak-to-peak times in wild-type and copy number tunable cells; n = 536 (wildtype), 336 (370 μM), 455 (92 μM), 616 (23 μM). d Cell length vs. timing error (standard deviation/mean of peak-to-peak intervals) in the 15% shortest cells (triangles), middle 70% cells (circles), and 15% longest cells (stars) for each condition. Vertical error bars indicate 95% confidence intervals from bootstrapping (5000 iterations), and horizontal error bars indicate standard deviation in cell length

