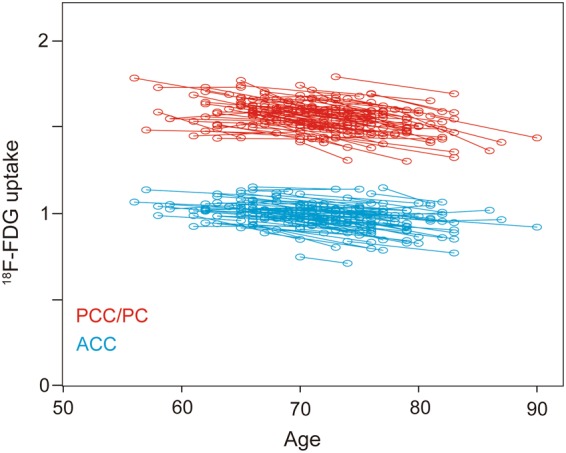
Figure 3.

Scatter plots depicting longitudinal changes in 18F-FDG uptake (n = 107). The shift in 18F-FDG uptake from the baseline PET scan to the second PET scan is shown at the participant level by the slopes connecting paired circles. The blue and red circles represent 18F-FDG uptake in the ACC and PCC/PC, respectively. 18F-FDG: fluorine-18-labeled fluorodeoxyglucose, ACC: anterior cingulate cortex, PCC/PC: posterior cingulate cortex/precuneus, PET: positron emission tomography.
