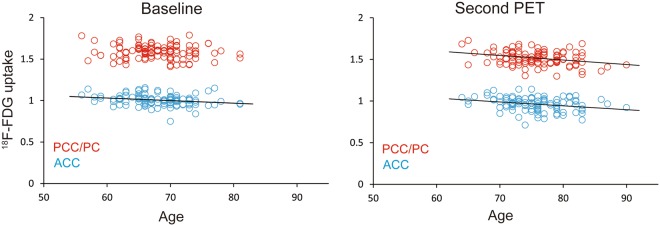
Figure 5.
Scatter plots depicting the relationship between 18F-FDG uptake and age at the baseline and second PET scans in all participants (n = 108). The blue and red circles represent 18F-FDG uptake in the ACC and PCC/PC, respectively. The results of the baseline scan (left) show a significant correlation in the ACC (r = 0.233, p = 0.016) but not the PCC/PC (r = 0.114, p = 0.240). The second PET scan (right) revealed significant correlations in the ACC (r = 0.274, p = 0.004) and PCC/PC (r = 0.303, p = 0.002). A solid line represents a simple regression line between the two variables. 18F-FDG: fluorine-18-labeled fluorodeoxyglucose, ACC: anterior cingulate cortex, PCC/PC: posterior cingulate cortex/precuneus, PET: positron emission tomography.

