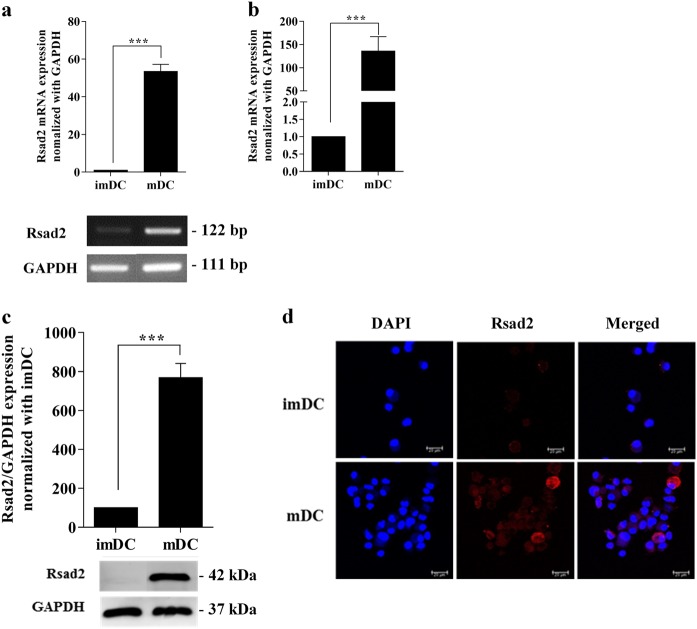
Fig. 1. Mature dendritic cells (mDCs) express high levels of Rsad2.
a PCR to detect Rsad2 expression in DCs. At day 8, DCs were cultured with LPS (1 µg/ml), KLH (10 µg/ml) for mDC, or control medium only for imDC. Values were normalized to GAPDH expression. RT-PCR analysis was repeated three times and data expressed as the mean ± SEM. b qRT-PCR assay to detect Rsad2 mRNA expression. The bar graphs show the mean fluorescence intensity, expressed as the mean ± SEM (n = 10 independent DC preparations). c Western blot analysis of Rsad2 expression. Data are representative of at least three independent experiments. d Immunofluorescence analysis of endogenous Rsad2 (red) expression in DCs. Nuclei are stained with DAPI (blue). *P < 0.05, **P < 0.01, and ***P < 0.001, compared with imDC

