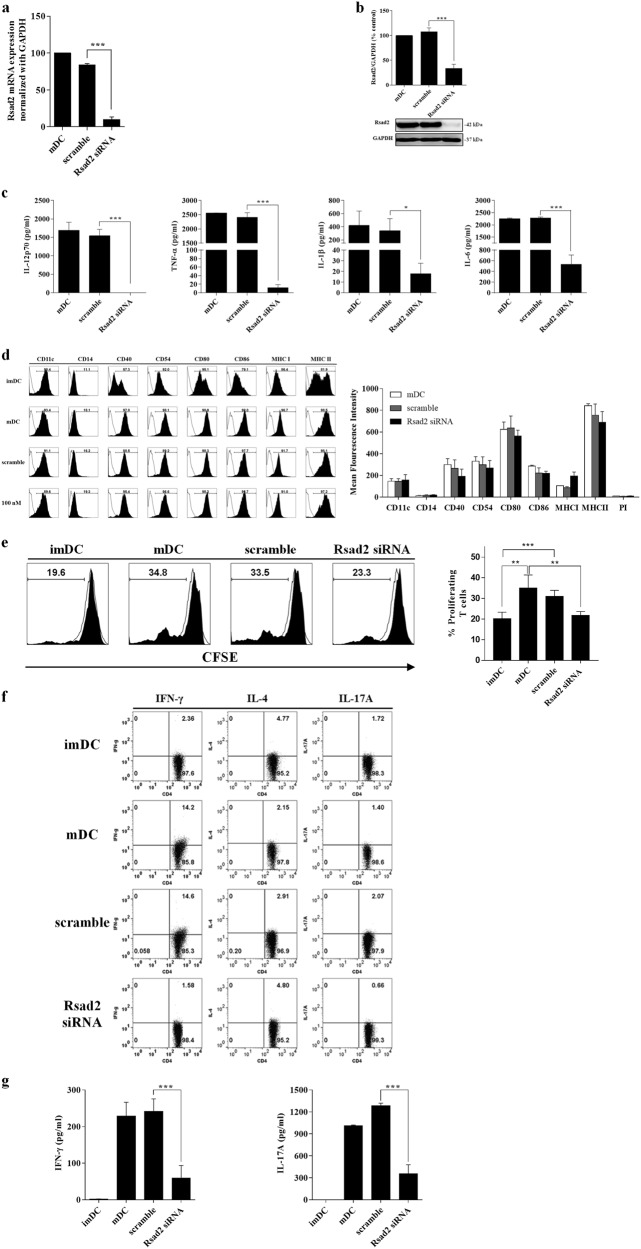
Fig. 2. Rsad2 knockdown mDCs are less efficient at stimulating T cells.
a qRT-PCR assay to measure Rsad2 expression in DCs. mDCs were cultured with LPS (1 µg/ml) or KLH (10 µg/ml), or in Rsad2 or scramble siRNA-transfected. Samples were normalized against GAPDH expression. The RT-PCR analysis was repeated three times and data presented as the mean ± SEM. b Western blot analysis of Rsad2 knockdown. Data are representative of at least three independent experiments. c Cytokine levels in supernatants from DC cultures measured by ELISA. Data are expressed as mean ± SEM (n = 10 independent DC preparations). d DC subsets (imDCs, mDCs, scramble-mDCs, and Rsad2 knockdown mDCs) were stained with the fluorescently-conjugated antibodies specific for the indicated molecules and analyzed by flow cytometry. Data are presented as histograms (data are representative of ten independent DC preparations). The bar graphs show the mean fluorescence intensity, expressed as the mean ± SEM (n = 10 independent DC preparations). e Each DC subset was co-cultured with CFSE-labeled CD3+ T cells and T cell proliferation measured after 72 h. The stimulator:responder ratio was 1:10. The bar graphs show the mean fluorescence intensity, expressed as the mean ± SEM (n = 10 independent DC preparations). f T cell subpopulations were analyzed by flow cytometry. DCs were co-cultured with CD3+ T cells and the Th1 (CD4+IFN-γ+), Th2 (CD4+IL-4+), and Th17 (CD4+IL-17A+) cell population were detected by flow cytometry. g Measurement of Th1/Th17 cytokines in culture supernatants from DCs/T cell co-cultures by ELISA. Data are expressed as mean ± SEM (n = 10 independent DC preparations). *P < 0.05; **P < 0.01; ***P < 0.001, compared with imDC

