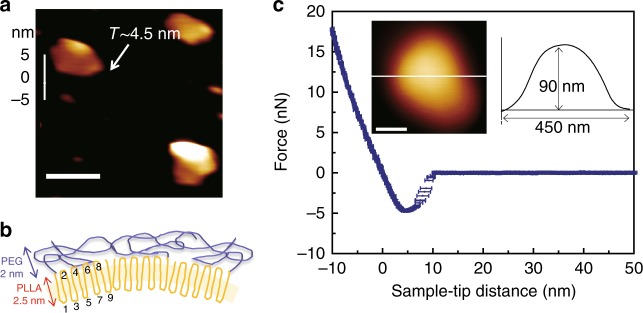
Fig. 3.
Mechanical properties of PLLA-b-PEG BCCs. a AFM image and corresponding height profile of a small crystal piece broken using ultrasonication; b Side-view of PLLA-b-PEG BCC shell in dried state, showing thickness of individual layer and PLLA chain folding; c AFM force-deformation spectrum on a PLLA-b-PEG crystalsome. Error bars represent standard deviation of sample-tip distances at different forces, n = 14. Inset: AFM image of the BCC used for the indentation test and its height profile. Scale bars are 100 nm

