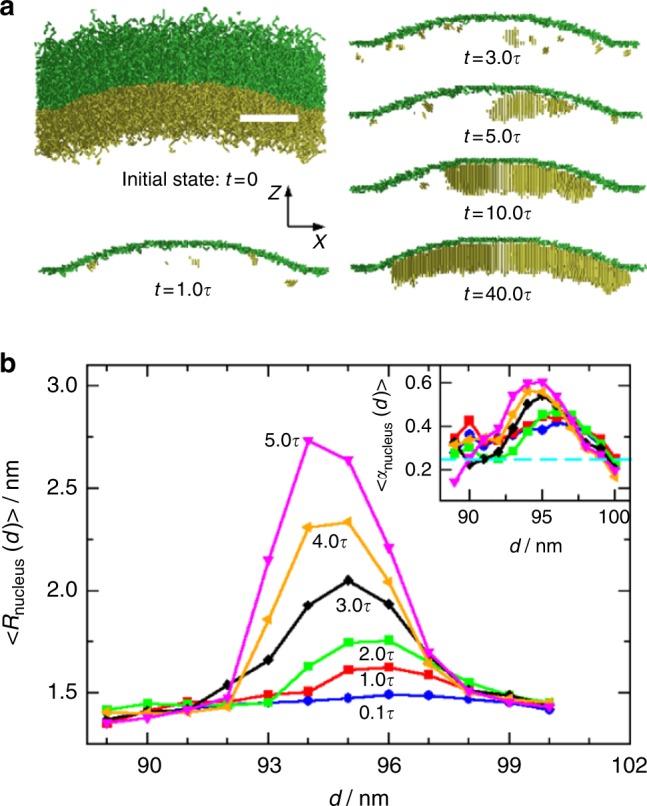
Fig. 4.

Simulation study of the PLLA crystals grown near the curved liquid−liquid interface. a Snapshots of initial state for the PLLA-b-PEG chains near the curved interface and the crystallized PLLA bonds at t = 1.0τ, 3.0τ, 5.0τ, 10.0τ, and 40.0τ. The snapshots are plotted in the range of 46 nm < y < 56 nm, where y = 51 nm is the cross-section xz plane through the droplet center. The yellow and green colors show the PLLA and PEG components correspondingly, and the green lines at different t show the position of liquid−liquid interface. b Radial distributions of average nucleus size at different time t = 0.1τ, 1.0τ, 2.0τ, 3.0τ, 4.0τ, and 5.0τ. Here the average is taken from 24 independent simulations, and the positions of nuclei/crystals are determined by its center of mass (CM). Inset shows the radial distribution of average nuclei orientation at different time, with the same color coding as that in the main panel. The dashed cyan line in the inset indicates that the nuclei have no preferred orientation statistically (see Supplementary Note 2). Scale bar in a is 20 nm
