
Fig. 2. Comparison of FA findings between MDD patients and HS.
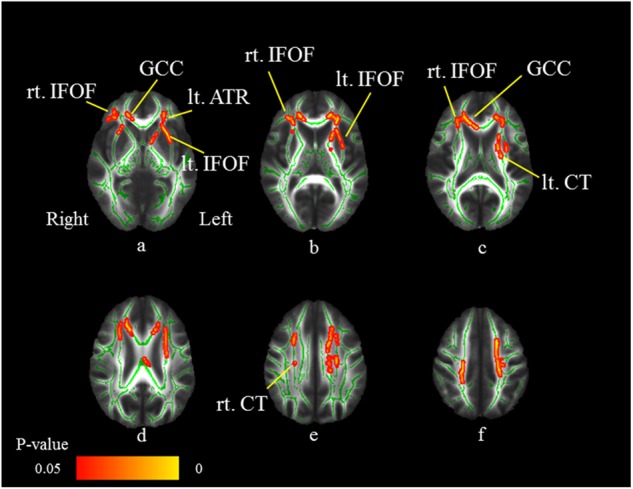
Axial slices (a–f) of the cohort’s mean FA skeleton (green) overlaid with red clusters depicting significantly lower FA values in the MDD patients compared to HS (FWE-corrected p < 0.05). The MDD patients have significantly reduced FA values (FWE-corrected p < 0.05) in the right corticospinal tract (CT: e), right inferior fronto-occipital fasciculus (IFOF: a–c), left anterior thalamic radiation (ATR: a), left CT (c), left IFOF, and genu of the corpus callosum (GCC: a, c)