
Fig. 3. Negative correlations between FA values and IL-1β levels in MDD patients.
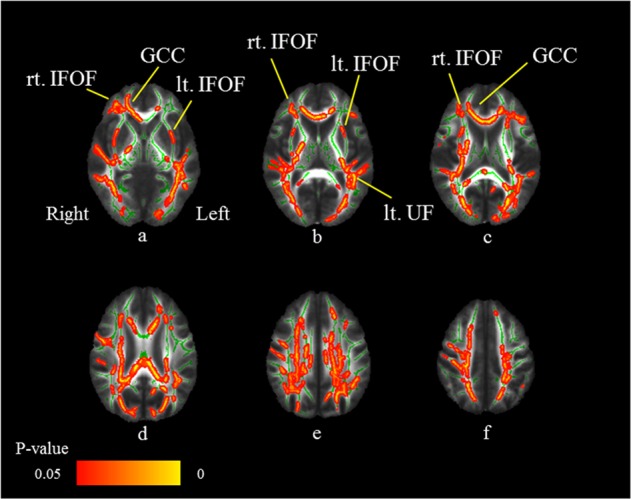
Axial slices (a–f) of the cohort’s mean FA skeleton (green) overlaid with red clusters depicting significantly negative correlations between FA values and serum IL-1β levels in the MDD patients (FWE-corrected p < 0.05). The FA values of the right inferior fronto-occipital fasciculus (IFOF: a–c), left IFOF (a, b), left uncinate fasciculus (UF: b), and genu of the corpus callosum (GCC: a, c) reveal significant negative correlations with the IL-1β levels (FWE-corrected p < 0.05)