Fig. 6.
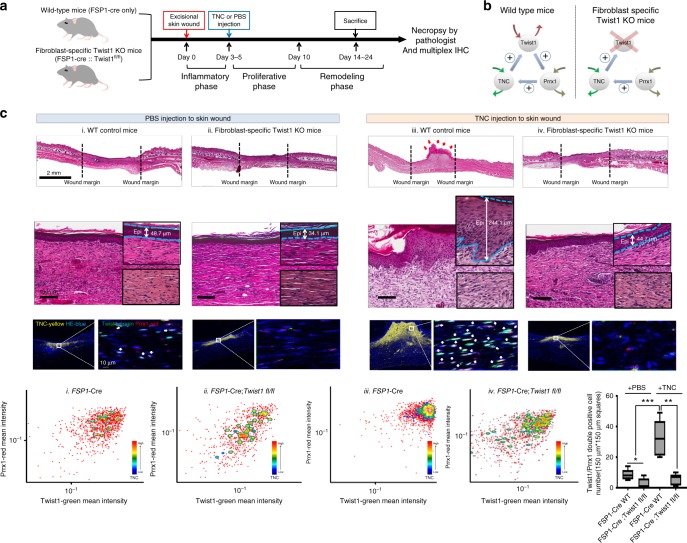
Sustained switching ON of the Twist1-Prrx1-TNC PFL triggers persistent fibroblast activation, forming fibrotic nodules in vivo during wound healing. a Schematic diagram of the experimental design. We injected TNC protein or PBS (control) into the wound area of WT and fibroblast-specific Twist1 knockout mice. The experiments were conducted three times (N = 5 mice in each experimental group). Experimental timeline for the detailed procedures is indicated. b The maintenance of the PFL activation by TNC injection (FSP1-cre; Twist1 WT mice, left) and disruption of PFL by fibroblast-specific Twist1 deficiency despite the TNC injection (FSP1- Cre;Twist1fl/fl mice, right). c H&E staining images showing the wound areas of each group (top). In Twist1 WT mice (depicted as iii, FSP1-cre; Twist1 WT), we observed fibroblastic nodules (red arrow) comprising hyper-proliferative immature fibroblasts and epithelial cell hyperplasia (blue dotted line). TNC is strongly expressed in most fibroblastic nodules as mentioned above in which Twist1 and Prrx1 are also strongly coexpressed. These results were obtained through multiplex IHC staining and visualized using ImageJ Fiji (Twist1-green, Prrx1-red, TNC-yellow, and hematoxylin-blue). We performed quantitative analysis of these results using FCS Express 6 image cytometry analysis software, and we presented the outcomes as an FACS plot (x axis-Twist1 green, y axis-Prrx1 red and contour indicated with TNC) (bottom). The number of fibroblasts displaying Twist1/Prrx1 double positivity in the TNC- or PBS-injected wound areas (150 μm × 150 μm square) is indicated by box plot (bottom right of Fig. 6c). Data are presented as the mean ± SEM; N = 6 independent measurements (two-tailed t test: **p<0.005, ***p<0.001)

