Figure 2.
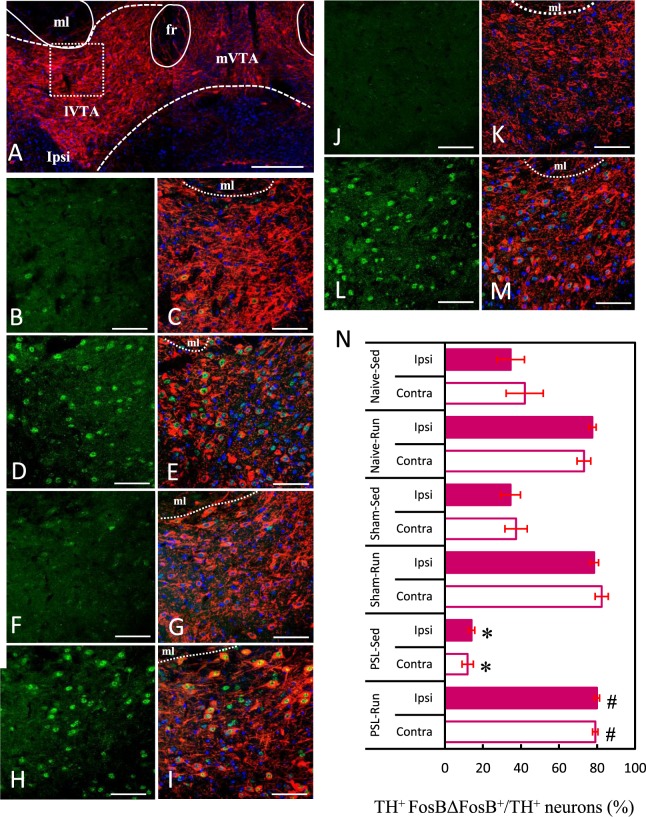
VWR/PSL-induced changes in lVTA-dopamine neurons. (A) Photomicrographs showing the anatomical region of lVTA with TH immunostaining (red). ml: medial lemniscus, fr: fasciculus retroflexus, lVTA: lateral VTA, mVTA: medial VTA. Photomicrographs show activated dopamine neurons in the lVTA of (B,C) Naive-Sedentary, (D,E) Naive-Runner, (F,G) Sham-Sedentary, (H,I) Sham-Runner, (J,K) PSL-Sedentary and (L,M) PSL-Runner mice. (B,D,F,H,J and L) indicate FosBΔFosB+ immunoreactivity, whereas (C,E,G,I,K and M) indicate dual immunostaining (FosBΔFosB+ TH+ DAPI). Bars: (A) = 200 μm, (B–M) = 70 μm. (N) A bar chart showing the proportion of activated dopamine neurons (TH+ FosBΔFosB+/TH+) in the lVTA in each group. As shown in (A) a square of 200 μm × 200 μm in size was placed on the lVTA in microscopy images, and TH+ FosBΔFosB+ cells within were counted. PSL significantly decreased the proportion of activated lVTA-DA neurons compared with that in other groups (n = 6, *p < 0.01 vs other groups), whereas VWR significantly increased the proportion of activated lVTA-DA neurons compared with that in other groups (n = 6, #p < 0.01 vs all sedentary groups).

