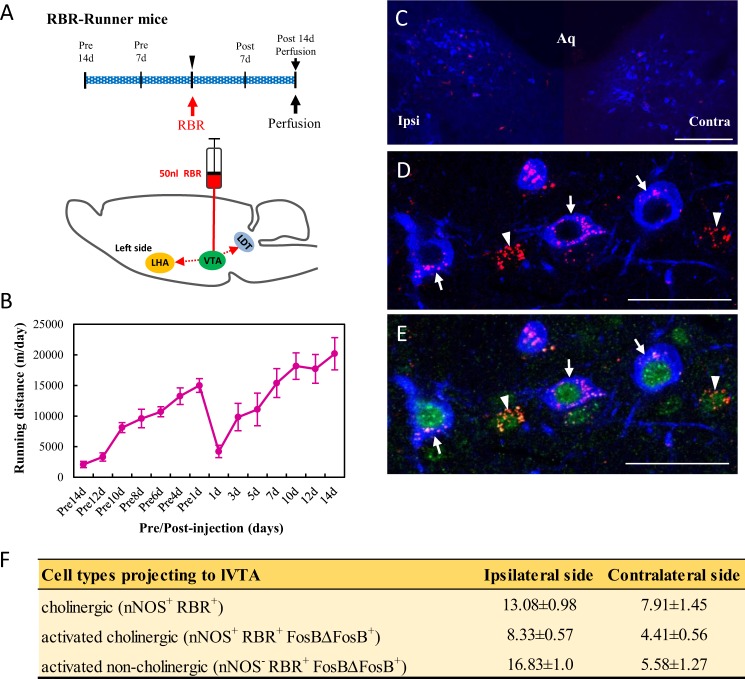
Figure 4.
lVTA-projecting LDT cholinergic neurons in Runner mice. (A) After two weeks of VWR, 50 nl of RBR was injected into the left side of the lVTA in mice, and RBR-injected mice continued VWR for 2 more weeks. (B) Changes in running distances in RBR-injected mice (n = 6). (C) Photomicrograph showing positive signals for RBR (Red) and nNOS (Blue) in the ipsilateral and contralateral sides of the injection in the LDT. Aq: aqueduct. (D,E) Photomicrographs showing positive signals for nNOS (Blue), RBR (Red) and FosBΔFosB (Green) in the LDT. Arrows and arrowheads indicate lVTA-projecting activated LDT-cholinergic (nNOS+ RBR+ FosBΔFosB+) neurons and lVTA-projecting activated LDT-non-cholinergic (nNOS− RBR+ FosBΔFosB+) neurons, respectively. Bars: (C) = 50 μm, (D,E) = 20 μm. (F) A table showing the quantitative results of cholinergic, lVTA-projecting activated cholinergic and lVTA-projecting activated non-cholinergic neurons on the ipsilateral and contralateral sides of the injection (n = 6). Quantitative data are presented as the mean ± standard error of the mean (SEM).

