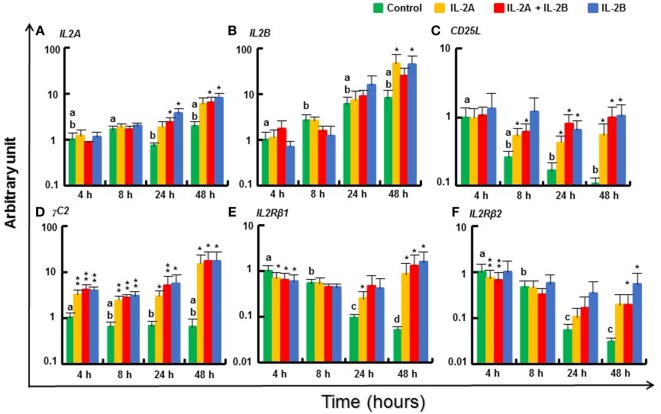
Figure 11.
Modulation of IL2 and IL2R gene expression by IL-2 isoforms in peripheral blood leukocytes (PBL). Freshly prepared PBL from four fish were stimulated with IL-2A, IL-2B, IL-2A + IL-2B, or with medium alone as control. The expression of IL2A (A), IL2B (B), CD25L (C), γC2 (D), IL2Rβ1 (E) and IL2Rβ2 (F) was quantified and presented as in Figure 8. Significant results of a paired samples T-test between the stimulated samples and time-matched controls are shown above the bars as *p ≤ 0.05, **p ≤ 0.01, and ***p ≤ 0.001. Different letters over the control bars indicate significant differences over time in the unstimulated cells (p ≤ 0.05). The expression levels in samples treated with IL-2B are higher than with IL-2A for IL2A at 24 h, and IL2Rβ2 at 48 h, but lower than with IL-2A for IL2Rβ1 at 4 h (p ≤ 0.05).

