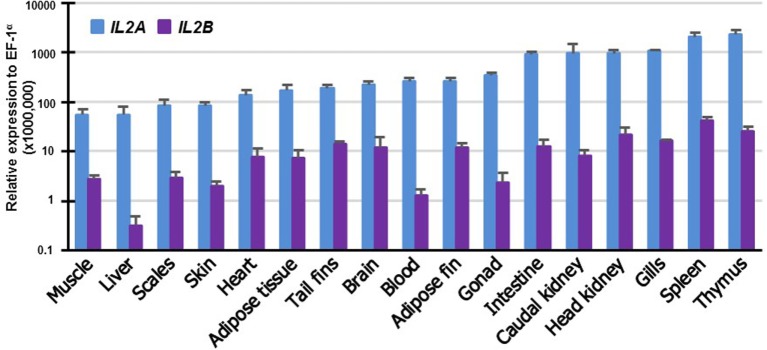
Figure 5.
Tissue distribution of transcript expression of IL2 paralogs in rainbow trout. The expression level of the two trout IL2 paralogs was determined by real-time RT-PCR in 17 tissues from six fish. The transcript level was calculated using a serial dilution of references that contained equal molar amounts of the probes for each gene and was normalized against the expression level of EF1α. The results represent the average + SEM of six fish.

