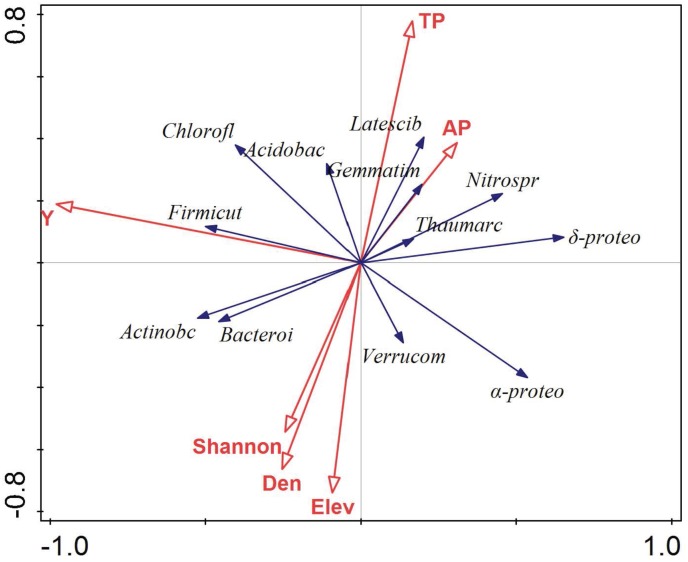
FIGURE 5.
Ordination plots of the results from the redundancy analysis (RDA) to identify the relationships among the microbial taxa (blue arrows) and environmental factors (red arrows). These are the abbreviation of microbial taxa: Actinobacteria (Actinobc), Alphaproteobacteria (α-proteo), Acidobacteria (Acidobac), Deltaproteobacteria (δ-proteo), Chloroflexi (Chlorofl), Thaumarchaeota (Thaumarc), Nitrospirae (Nitrospr), Bacteroidetes (Bacteroi), Gemmatimonadetes (Gemmatim), Latescibacteria (Latescib), Verrucomicrobia (Verrucom), and Firmicutes (Frimicut); the abbreviation of environmental factors: the location of the plots (Y), total phosphorus (TP), available phosphorus (AP); elevation (Elev), Shannon index (Shannon), plant density (Den). Each vector points to the direction of increase for a given microbial phylum and its length indicates the strength of the correlation between the variable and the ordination scores.

