
Figure 8.
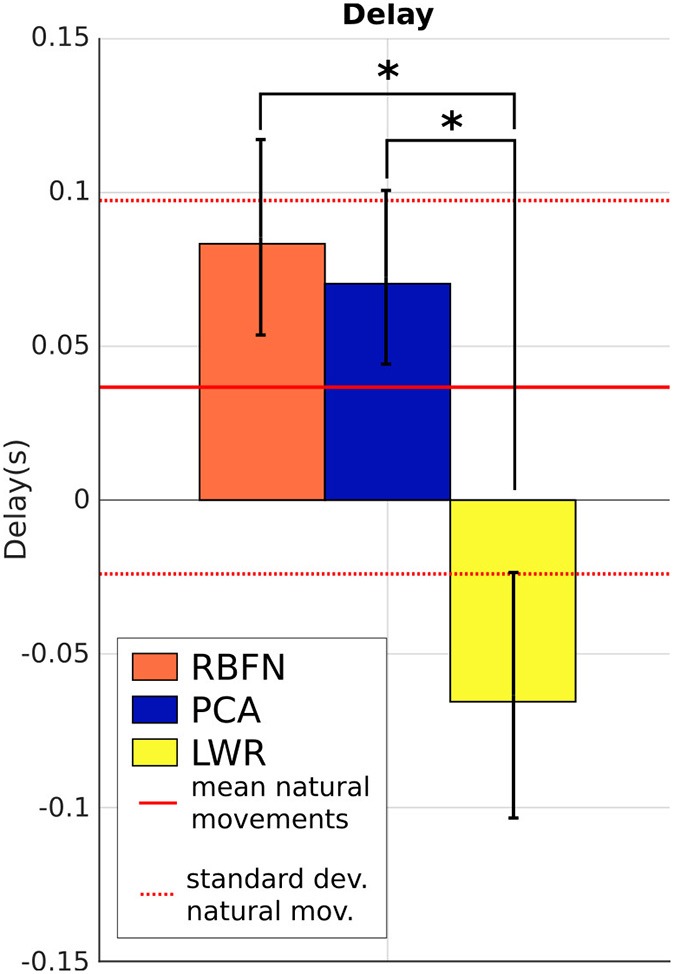
Δt, delay between the shoulder and the elbow motions, that illustrates the time of response of the model, mean over subjects and targets. Straight and dotted red lines are respectively the mean and standard deviation of the values from natural reaching motions without the prosthesis. *indicates a statistically significant difference (p < 0.05).