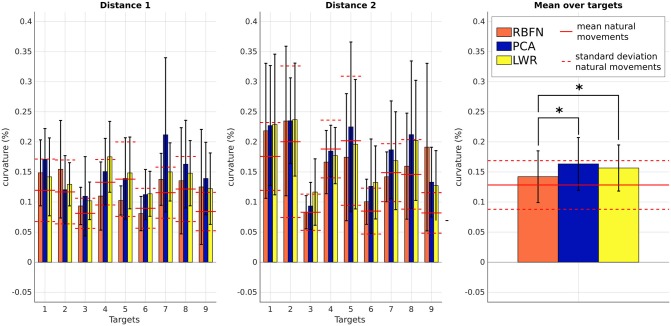
Figure 9.
Curvature c of the movements obtained by the three regression models. Values are averaged over subjects. From left to right: c for targets of distance 1, c for targets of distance 2 and mean of c over targets. Straight and dotted red lines are respectively the mean and standard deviation of the values from natural reaching motions without the prosthesis (preliminary experimental session). Numbers correspond to the targets location, see Figure 2. *indicates a statistically significant difference (p < 0.05).

