
Figure 2.
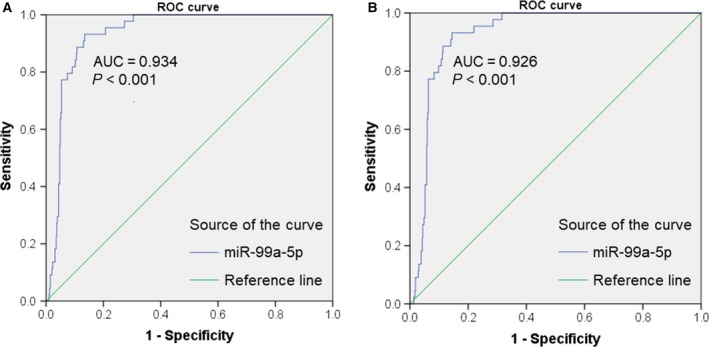
Receiver operating characteristic (ROC) curves of miR‐99a‐5p in HNSCC based on TCGA data. (A) Diagnostic value of miR‐99a‐5p for HNSCC based on the IIIuminaHiseq platform (AUC = 0.934, P < 0.001). (B) Diagnostic value of miR‐99a‐5p for HNSCC based on the IIIuminaHiseq and IIIuminaGA platforms (AUC = 0.926, P < 0.001).