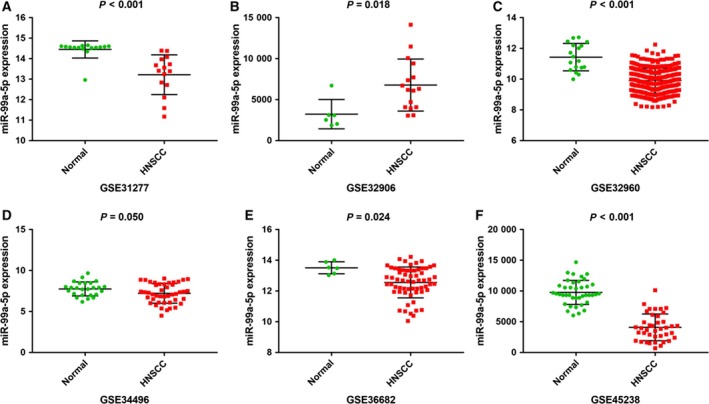
Figure 4.

Representative scatter plots of miR‐99a‐5p expression data in normal and HNSCC tissues in microarrays. Expression data of miR‐99a‐5p in normal and HNSCC tissues from microarrays with P value ≤ 0.05 were plotted: (A) http://www.ncbi.nlm.nih.gov/geo/query/acc.cgi?acc=GSE31277 (P < 0.001). (B) http://www.ncbi.nlm.nih.gov/geo/query/acc.cgi?acc=GSE32906 (P = 0.018). (C) http://www.ncbi.nlm.nih.gov/geo/query/acc.cgi?acc=GSE32960 (P < 0.001). (D) http://www.ncbi.nlm.nih.gov/geo/query/acc.cgi?acc=GSE34496 (P = 0.050). (E) http://www.ncbi.nlm.nih.gov/geo/query/acc.cgi?acc=GSE36682 (P = 0.024). (F) http://www.ncbi.nlm.nih.gov/geo/query/acc.cgi?acc=GSE45238 (P < 0.001).
