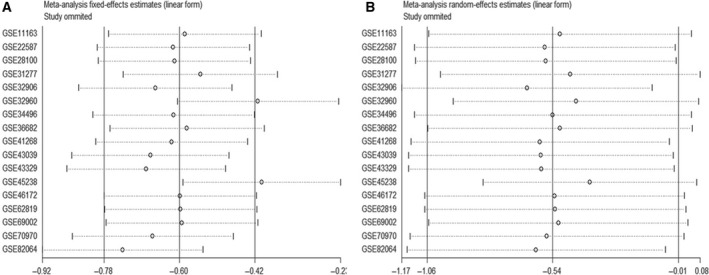
Figure 6.

Sensitivity analysis. (A) Fixed‐effect model. (B) Random‐effect model. http://www.ncbi.nlm.nih.gov/geo/query/acc.cgi?acc=GSE45238 and http://www.ncbi.nlm.nih.gov/geo/query/acc.cgi?acc=GSE32960 might be sources of heterogeneity according to the fixed‐effect model.
