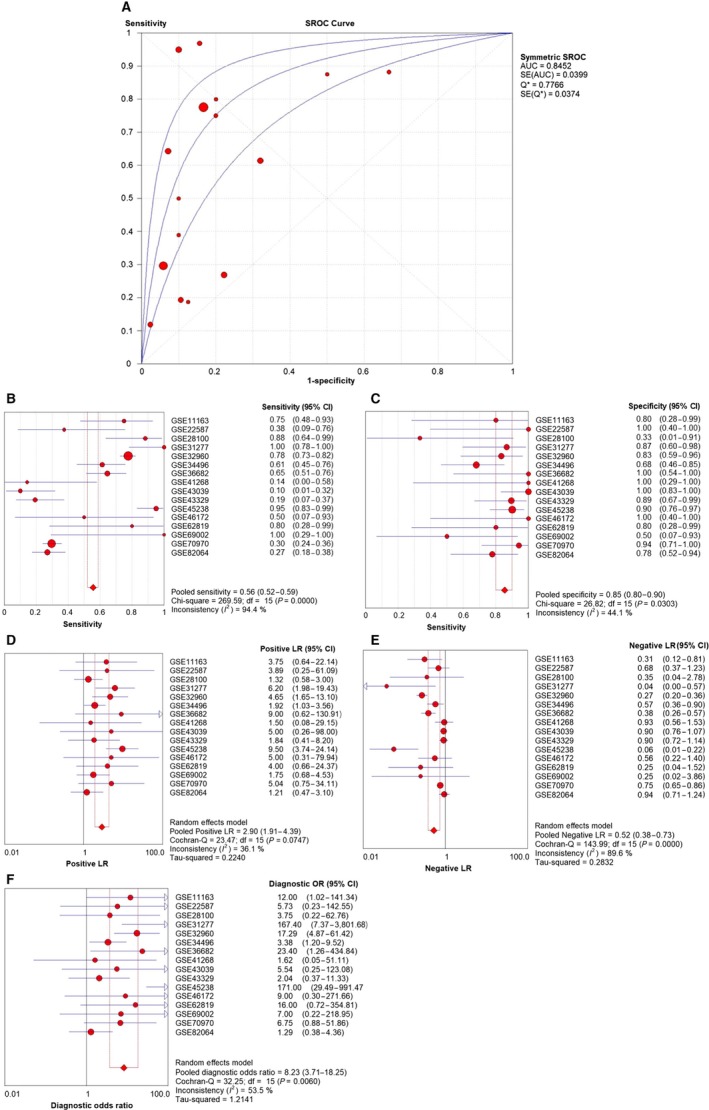
Figure 9.

Diagnostic test based on the 17 included microarrays. (A) The summarized receiver operating characteristic (SROC) curve (AUC = 0.85, 95% CI = 0.77–0.92 calculated manually). (B) Sensitivity value of 0.56 (95%CI = 0.52–0.59, P < 0.001). (C) Specificity value of 0.85 (95% CI = 0.80–0.90, P = 0.030). (D) Pool positive likelihood ratio of 2.90 (95% CI = 1.91–4.39, P = 0.074). (E) Pool negative likelihood ratio of 0.52 (95% CI = 0.38–0.73, P < 0.001). (F) Diagnostic odds ratio of 8.23 (95% CI = 3.71–18.25, P = 0.006).
