Figure 11.

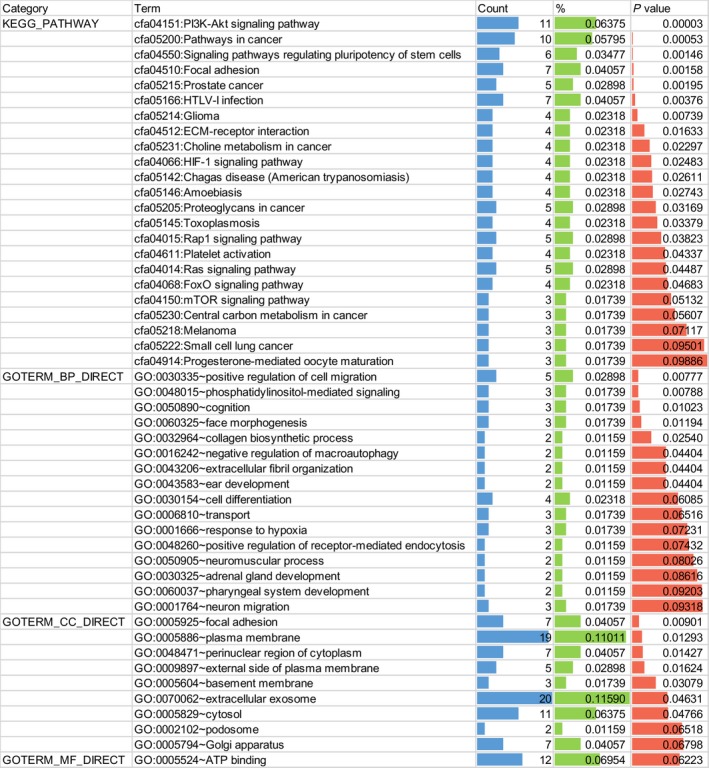
Functional annotation of target genes by GO enrichment and KEGG pathway analysis (P value < 0.05 for KEGG, BP, and CC).

Functional annotation of target genes by GO enrichment and KEGG pathway analysis (P value < 0.05 for KEGG, BP, and CC).