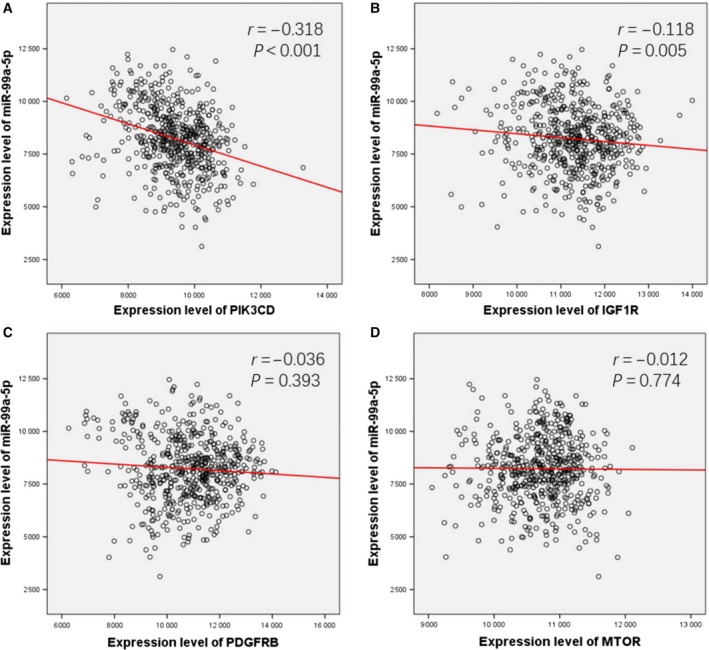
Figure 15.

Spearman's correlation analysis. Expression value of PIK3CD (A), IGF1R (B), PDGFRB (C), and MTOR (D) and their correlations with miR‐99a‐5p.

Spearman's correlation analysis. Expression value of PIK3CD (A), IGF1R (B), PDGFRB (C), and MTOR (D) and their correlations with miR‐99a‐5p.