Figure 3.

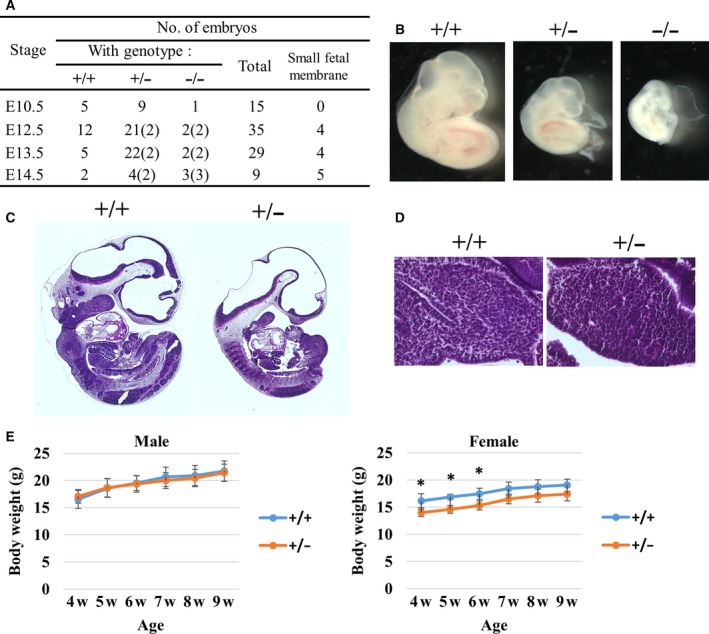
Essential role of eIF3e in mouse embryonic development. (A) Genotyping and phenotyping analyses of embryos obtained from heterozygous intercrosses. The number of abnormal small fetal membranes is indicated in parentheses. (B) Representative images of eIF3e +/+, eIF3e +/−, and eIF3e −/− embryos at E10.5. Hematoxylin and eosin staining of E10.5 whole embryos (C) and a magnified image of fetal liver (D). (E) Time‐course change of weight from weaning (4 weeks) to 9 weeks of age. Body weights shown by points represent mean values with SD. (*two‐way ANOVA for age/genotype; P < 0.001, followed by Bonferroni's post hoc multiple comparison test; P < 0.05, n = 5 for each group).
