
Figure 4.
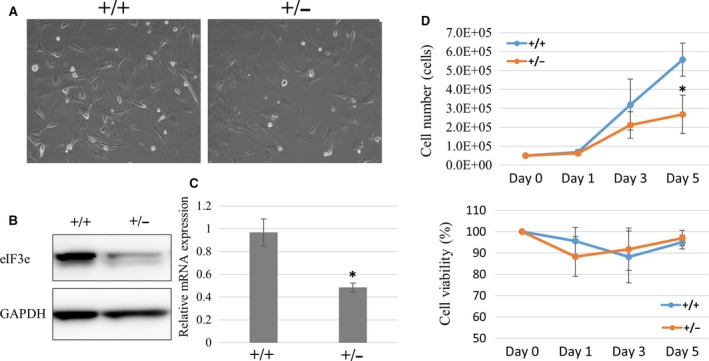
Impaired proliferation of eIF3e +/− cells. (A) Microscopy images of MEFs established from eIF3e +/+ (+/+), eIF3e +/− (+/−) mice embryos. (B) Western blotting of eIF3e and GAPDH as a loading control (left) and (C) qRT‐PCR showing the eIF3e mRNA expression normalized by 18S rRNA gene (right) in the eIF3e +/+ and eIF3e +/− MEFs. Columns represent mean values with SD from two independent experiments. (D) Cell numbers and viability of eIF3e +/+ and eIF3e +/− MEFs from three clones each. Cell numbers are counted at 1, 3, and 5 days after starting to culture cells at 5 × 10⁴. Viabilities (%) calculated by trypan blue exclusion test are shown at 1, 3, and 5 days. Columns represent mean values with SD from three independent experiments. The asterisk indicates P < 0.05 when compared to eIF3e +/+.