Figure 5.

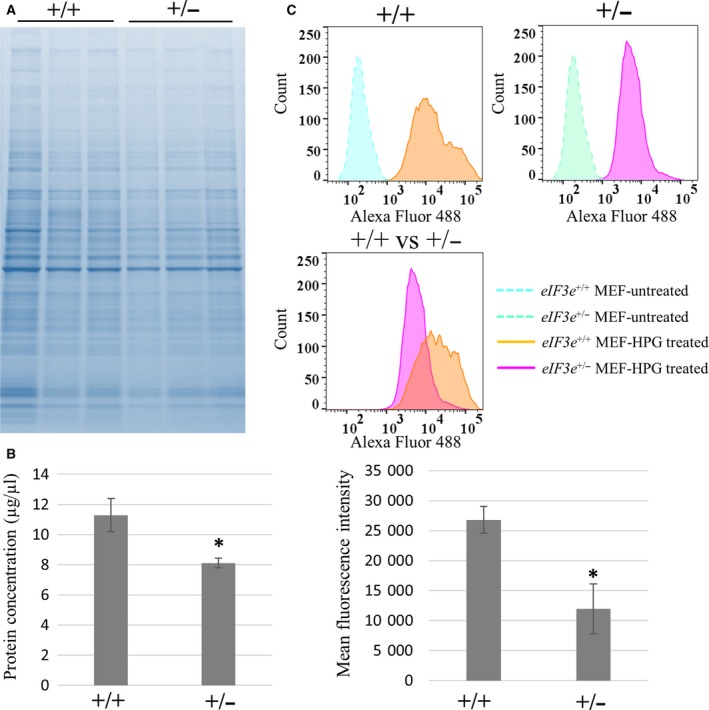
Decrease in translational activity in eIF3e +/− cells. (A) Total protein level of eIF3e +/+ and eIF3e +/− MEFs. Each lane represents a sample from an individual animal. Protein lysates were visualized by CBB staining. (B) Protein concentrations of MEF lysates were measured by the BCA method. Columns represent mean values with SD from three independent sets of three MEF clones. (C) HPG incorporation of eIF3e +/+ and eIF3e +/− MEFs demonstrated by FACS. FACS histograms are representative of three independent experiments. Histogram representing HPG‐treated and HPG‐non‐treated cells are shown in the upper panel, and HPG‐treated eIF3e +/+ MEFs (purple) and eIF3e +/− cells (orange) in the middle panel. Bar graph shows the mean fluorescence intensity values for HPG‐incorporated cells (mean ± SD) from three independent FACS experiments. The asterisk indicates P < 0.05 when compared to eIF3e +/+.
