Figure 6.

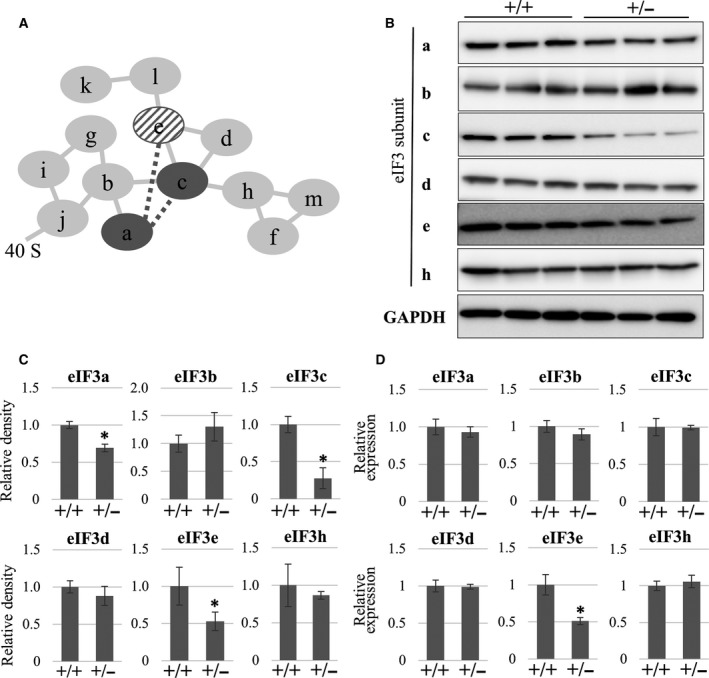
eIF3e deficiency selectively leads the decrease in eIF3a and eIF3c protein expression. (A) The diagram shows subunit interactions within the eIF3 complex. Each line indicates subunit–subunit interaction based on a mass‐based study (solid lines) 27 or protein‐based assay (dotted lines) 28. Dark gray circles (eIF3a and eIF3c) and a diagonal circle (eIF3e) indicate the targets affected by eIF3e disruption. (B) Western blotting of the indicated eIF3 subunits in the total cell lysates of eIF3e +/+ (+/+) and eIF3e +/− (+/−) MEFs. GAPDH was used as a loading control. (C) Protein expression of the indicated eIF3 subunits. Band densities from western blot results were calculated and are shown by the columns representing the mean values with SD. (D) qRT‐PCR showing mRNA expression of the indicated eIF3 subunits. mRNA expression of each gene was normalized using that of the 18S rRNA gene. Columns represent mean values with SD from three independent experiments. The asterisk indicates P < 0.05 when compared to eIF3e+/+.
