Figure 8.

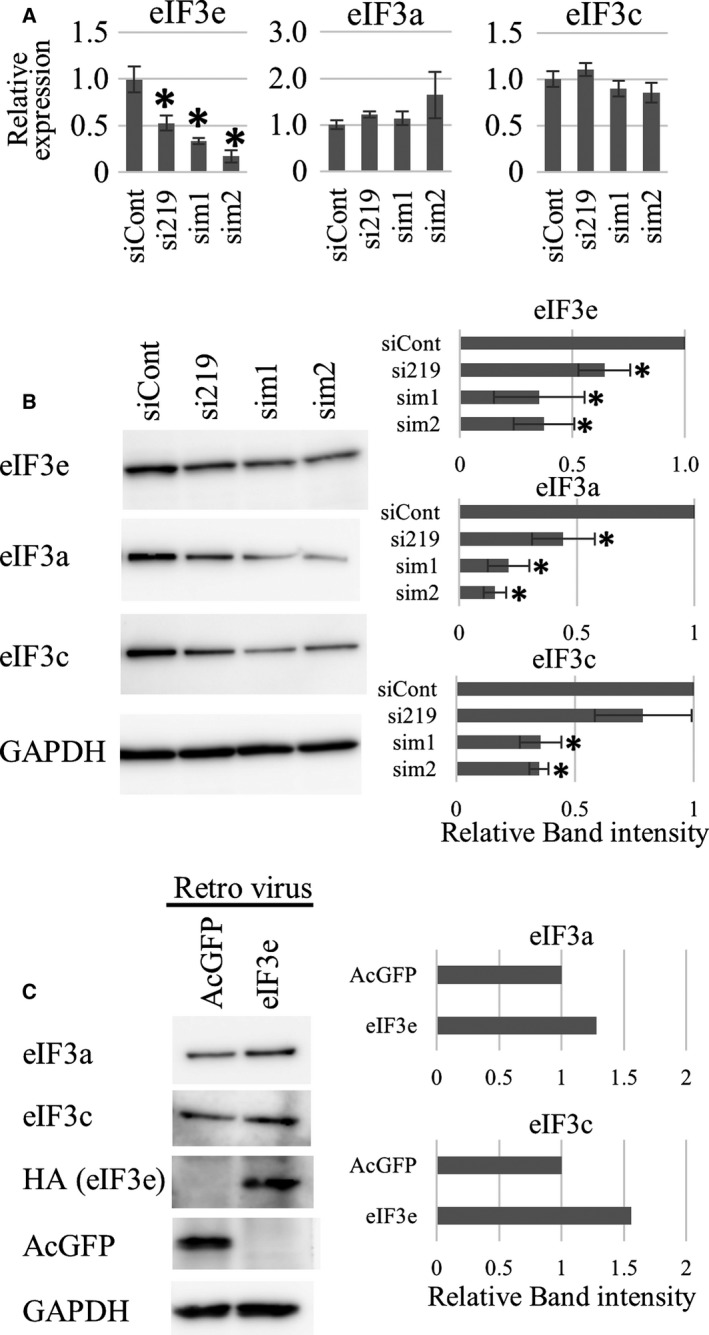
Effects of eIF3e silencing and forced eIF3e expression in eIF3e +/− MEFs. (A) qRT‐PCR showing mRNA expression of eIF3a, eIF3c, and eIF3e. mRNA expression of each gene was normalized to that of the 18S rRNA gene. Columns represent mean values with SD from three independent experiments. The asterisk indicates P < 0.05 when compared to siCont‐transfected MEFs. (B) Western blotting of eIF3a, eIF3c, and eIF3e in the total cell lysates of wild‐type MEFs transfected with the indicated siRNA species. GAPDH was used as a loading control. Band densities from western blot results were calculated and are shown by the columns representing the mean values with SD. The asterisk indicates P < 0.05 when compared to siCont‐transfected MEFs. (C) Western blotting of the indicated eIF3 subunits and transgenes (HA: exogenous eIF3e; AcGFP: control) in the total cell lysates of eIF3e +/− MEFs infected with the indicated genes packaged by retroviruses. GAPDH was used as a loading control. Western blot and relative band intensities were representative of three independent experiments.
