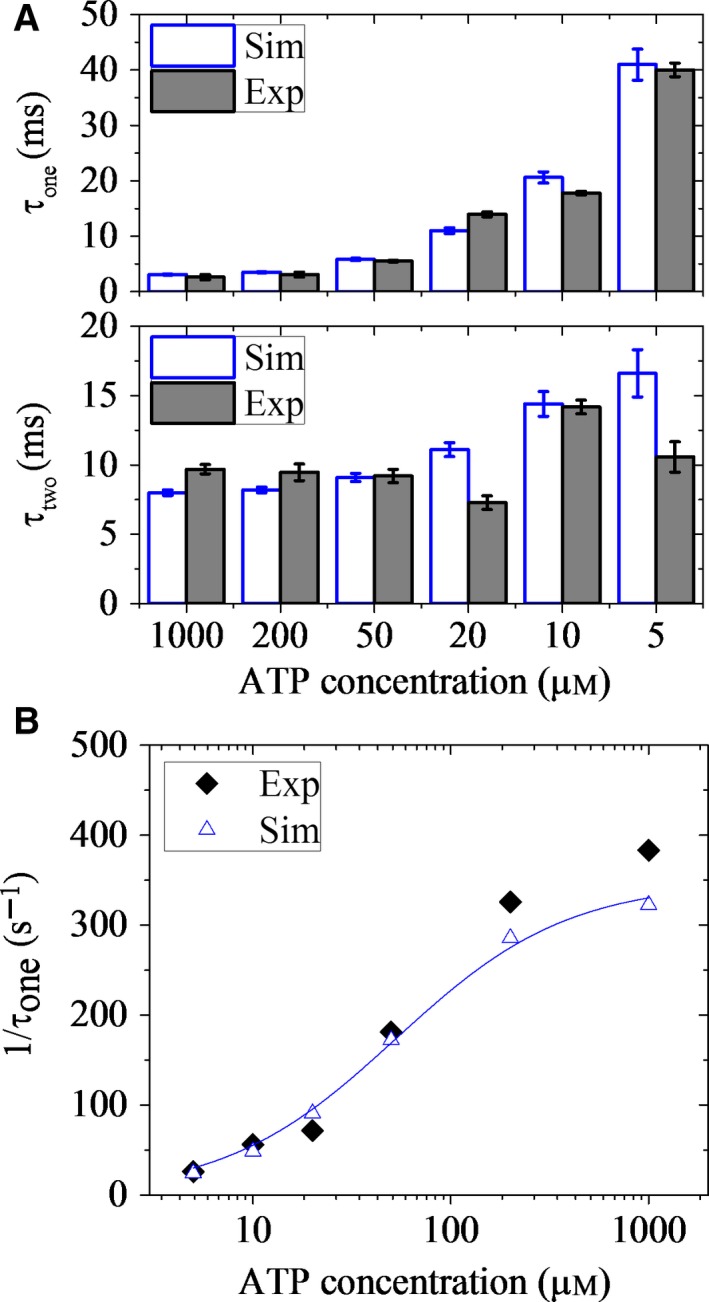
Figure 4.

Durations of one‐head‐bound (1HB) and two‐head‐bound (2HB) states during processive movement of cysteine‐light (CL) human kinesin‐1 under no load. (A) Mean durations of 1HB state (upper) and 2HB state (lower) versus ATP concentration. Open columns are calculated data, and filled columns are experimental data taken from Isojima et al. 60. Error bars represent SEM (n = 1000). (B) Inverse of the mean duration of 1HB state as a function of ATP concentration. Open symbols are calculated data, and filled symbols are experimental data taken from Isojima et al. 60. Line is the fit with the Michaelis–Menten equation, 1/τ1 = k cat [ATP]/KM + [ATP]). The fit parameters are k cat = 348 s−1 and KM = 53 μm.
