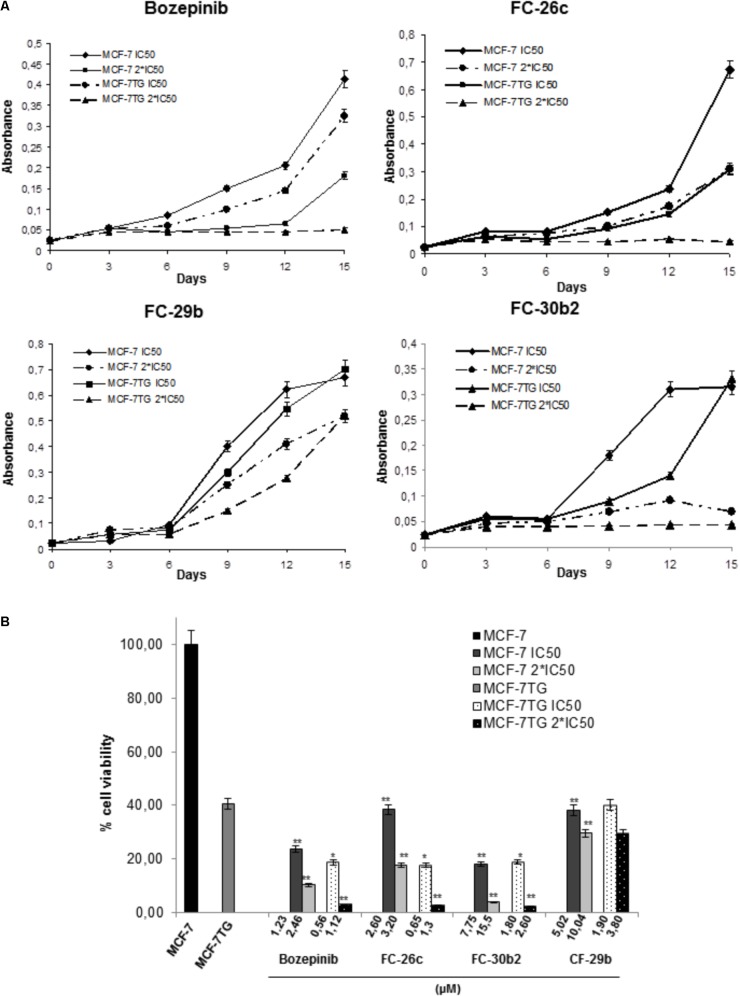
FIGURE 3.
Determination of the effects of the combination of gef gene expression with bozepinib, FC-26c, FC-29b, and FC-30b2 on cell proliferation. (A) MCF-7 and MCF-7TG cell lines were treated with IC50 and 2∗IC50 of different compounds during 15 days. Data are expressed as the mean ± standard error of the mean of three independent experiments. (B) Percentage of cell viability after 15 days of treatment with different compounds expressed in comparison to the maximal MCF-7 (100%). The statistical analysis was performed using each cell line without drug exposure as controls. ∗P < 0.05, ∗∗P < 0.01 (t-test).

