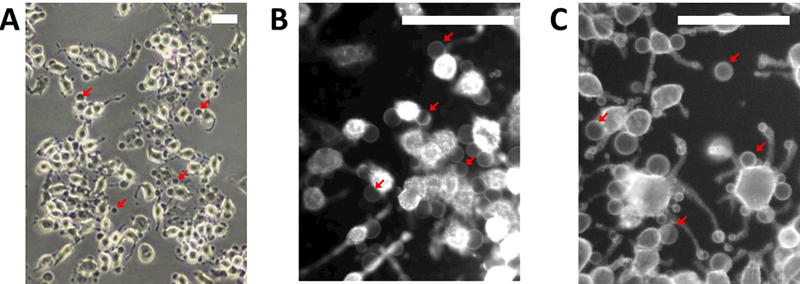
Figure 2: Phase contrast (A) and fluorescent (B,C) images of cell attached GPMVs.

(A) GPMVs appear dark in phase contrast images and can be seen attached to cells or flowing above the adherent cell layer (not shown). (B) Cell attached GPMVs are difficult to visualize when cells membranes are fluorescently tagged prior to incubation with active vesiculation buffer due to trafficking of fluorophores to internal membranes. (C) GPMVs and their parent cell membranes have roughly the same fluorescent intensity when cells are labeled after incubation with active vesiculation buffer. Red arrows point to GPMVs in all panels. Scale bars are 100μm.
