. 2018 Jul 5;15(4):329–336. doi: 10.21873/cgp.20091

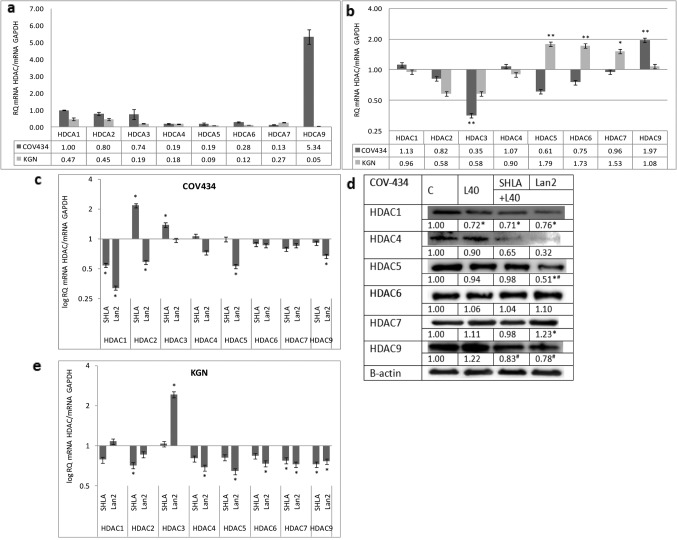
Figure 2. Basal expression of histone deacetylase genes (a). Effect of leptin (b) and leptin receptor antagonists on HDAC gene and protein expression in COV434 cell lines (c, d) and gene expression in KGN cells (e). Basal and leptin-stimulated mRNA values was evaluated by qPCR after 24 h of cell culture and the results were normalised to HDAC1 expression in COV434 cells with a value equal to 1. All values marked with *p<0.05 and **p<0.01 are significantly different from control values. Values are mean±SEM. HDAC densitometry results were normalised to β-actin loading control to obtain band ratios. All values marked with #p<0.05 are significantly different from the values of leptin at 40 ng/mL.

Figure 2