. 2018 Jul 5;15(4):273–278. doi: 10.21873/cgp.20085

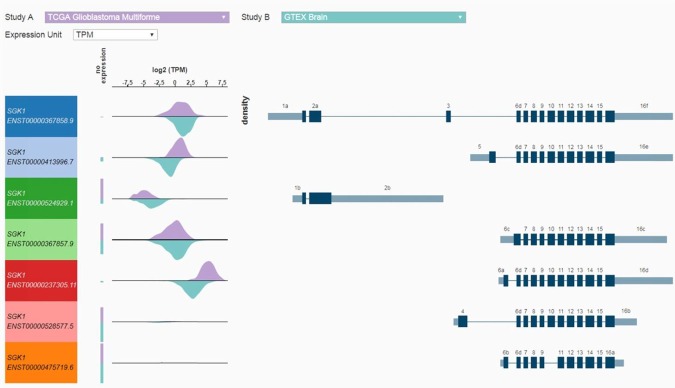
Figure 4. SGK1 Transcript-specific expression (7 transcripts) for ‘tumor’ TCGA data (lavender) and ‘normal’ (blue-green) GTEX data (TPM transcripts per million). All RNAseq data were generated by the Toil pipeline, recompute done by the UCSC Computational Core using the RSEM package. All seven transcripts are from Gencode V23 comprehensive annotation. The exons are numbered using a UCSC Computational Core method which may not line up with exon numbering in the literature. Regions that are intronic in all transcripts are removed. The remaining exonic regions are numbered 1-16. For example, exon 4 is the unique exon in the 4th exonic region. Different exons within a given region are labeled starting with ‘a’ for the left-most exon (in transcript direction). Exons 6a, 6b, 6c, and 6d are four different exons in the sixth exonic region. In other words, different exons across all transcripts which overlap transitively, that is, partially across the adjoining exon, are assigned the same integer. So if one transcript has exons 6a and 6c, there must be exons in other transcripts that overlap them, and each other. Note that it is fairly common for a gene to have transcripts with non-overlapping exons, depending on the gene, its function, the location of the protein coding domains, and where that particular transcript was observed.

Figure 4